Jimi: a market watchtower built the hard way
How a market watchtower was rebuilt from the ground up — the real milestones, the alerts that proved worth it and the ones that didn't, weekend research sessions, after-action reviews, and the tools that only exist because of failures first. Written on a Saturday, so the market data in the screenshots is Friday's close.
I'm a novice day trader, still very much learning the ropes. Not a market veteran with decades of screen time behind me, not someone with a wall of hard-won lessons. A few months ago I had a day job, a passing interest in markets, and a growing desire to see what a real, hands-on piece of AI-built trading technology could do for me. So I decided to build my own market watchtower, and I built it as a beginner, which turned out to change everything about how it had to work.
This is a technical deep-dive, written on a Saturday, so the market data you'll see in the screenshots is Friday's close. What I want to walk through is less "here's a cool dashboard" and more "here's how a serious piece of software comes together when you refuse to ship junk", and how a novice can build something like this with the right partner.
It's the story of Jimi, a market watchtower built by a software engineer and an AI assistant working as a deliberate, iterative team. A dozen sections in the UI, a catalog of alerts we've studied and triaged, a rigorous working discipline we call the RELIGION, and a home lab of hardware that runs it all.
TL;DR: Jimi is a self-built, AI-assisted market watchtower for trading US equities — a novice day trader's journey to stop fooling himself. It tracks US-listed stocks (Ranked, Alerts, Watchlist, 30D, Playback), streams live prices push-first, and checks every signal statistically before it surfaces. Built for the trader who wants a system that refuses to flatter them, not a black box that trades for you.
A note on who's building this
It's worth being blunt about what I am and am not, because it shapes every screenshot below. I am a novice day trader. I'm still finding my edge: pullback and panic-bounce entries, watching micro-cap movers, studying other traders' process to learn what separates a real setup from a noisy pump. I do not have a track record, and I say that plainly precisely because the tools in front of you were built to compensate for it.
Where I'm not a novice is software itself. I'm a software engineer with over forty years of experience writing code by hand, and it's a genuinely novel, almost novice feeling to have the AI write that code for me while I direct it. The market may be new to me; the craft of building software is where I know what I'm doing, which is exactly why this partnership works the way it does.
Everything Jimi does is aimed at a beginner who refuses to stay a beginner: candour about stale data, alerts that are statistically checked instead of hoped-for, a position sizer that tells you how much you can afford to lose before it tells you how many shares to buy, and a journal that forces you to write your reasoning down so you can look back and learn. The software is the scaffolding a novice uses to build habits, not a magic box that trades for you.
The RELIGION, and why there is one
Before any code, we agreed on a working discipline. We called it the RELIGION, half joking, but it's stricter than it sounds. It revolves around Merl, our own lightweight project tracker, the ledger of the whole project and, as it turned out, its long-term memory. Every ticket, every decision, every fix is logged there and recoverable, which is what makes the discipline hold together:
- Every change is a Merl ticket, logged with a running timer before any work starts.
- Design before code. No feature ships from a blank page; it iterates until it's reviewed against what we've already learned.
- Tests are religion. Unit, contract, canary, browser, replay. Tests aren't a chore. They're how we prove the next change didn't silently break something.
- Machine stability over speed. This is the standing rule. We never hurry the market. Each phase is tested before the next begins.
- Write down the lessons. Incidents become inventory, and inventory becomes the spec for the next iteration. We never rediscover the hard way twice.
Projects are self-contained — that's part of the RELIGION too. Jimi owns its own config, its own data sources, its own state; nothing depends on a particular machine's quirks. Which is why, in the future, a project is meant to be relocatable to other machines, probably packaged as a container. That last one is the whole ballgame, and it's why the rewrite exists at all. For a novice it matters double: when you can't lean on experience, you lean on process.
Why the rewrite: a system that couldn't be trusted
Jimi is the successor to an older watchtower that had accumulated every kind of debt production software can. Four provider migrations, thousands of lines, multiple state stores, and a failure record that made us stop believing its output.
The incidents were the ordinary kind that never show up in a demo, and every one was ultimately about truthfulness:
- Stale quotes served as live. A frozen prior-session price looked like a real gap until you cross-checked. We saw +100% phantom gaps and dead tickers that kept shouting all premarket.
- State that resurrected the dead. Purged alerts re-seeded themselves at boot from persisted state. Dead tickers never died.
- A reverse split that looked like +864%. One bad adjustment, and every indicator downstream (range, MACD, momentum) invented a move that never happened.
- Rate-limit storms. Cache expiry aligned and fired 1,700 calls in a burst, tripping the provider cap and leaving no tape all night.
- Code that shipped untested. JavaScript merged without a browser pass, breaking whole tabs silently.
None of these were a single bug. They were architecture that looked like symptoms: staleness that was guessed instead of computed, state that could contradict itself, no single provider contract, no canary watching the meta. The fix wasn't more patches. It was a ground-up rebuild that encoded every hard-won lesson as design.
Rebuilding with the edge
The whole thing hums on a serious home lab. The inferencing lives on a pair of NVIDIA GB10 boxes (MSI EdgeXpert machines doing tensor-parallel inference) while Hermes (this assistant) and the MySQL database run on a Corsair AI Workstation 300 with 128GB of Strix Halo. That's the muscle underneath everything you see here, and it shaped every decision: we're building genuinely local, genuinely owned infrastructure rather than renting it.
Everything runs on Linux: every machine in the lab, end to end. And the whole thing is built in Python: the feed, the scanner, the analysis, the web layer. The same friendliness that makes Python fast to prototype is what let a novice to the market go from idea to working watchtower without losing the discipline. The data layer is provider-agnostic: Jimi ships with pluggable data-provider plugins (Alpaca, FMP, and Yahoo) so different deployments can choose the vendor that suits them, and the feed isn't married to any one of them. The storage layer is the same way: different database plugins for different systems, chosen per deployment. And the inference servers that power the analysis are configurable in Settings, so which model answers depends on what the machine in front of it can run.
Here's how the rebuild ran, with the AI's help from the start. I made the design calls and owned the hard decisions; the assistant wrote and debugged real code, ran the systems, and dug into primary sources when we hit a wall.
That division turned out to be the edge: the AI made us more rigorous, not less, because it never let us hand-wave a test we couldn't run. Design docs were self-critiqued against the failure inventory before the next pass. Every unit test was run, not assumed. When a switch flipped, the code had been exercised, not described.
Two big architectural bets carried the redesign:
- Push-first data. Live prices stream over a WebSocket instead of polling REST. Polling is the root of staleness: 2-second latency, per-minute caps, token-bucket bugs. The socket is primary; REST exists only for history and fallback.
- Freshness is computed, never guessed. Every price carries its source timestamp and session, and the ingest layer refuses stale data at the edge with a logged reason. There's no downstream watchdog trying to detect what was never allowed in.
The scanner became a pure function (same inputs, same signals) which made tests and replays meaningful. And we ran the new system beside the old one, diffing alerts, before anything was trusted. Jimi went live as the production watchtower, replacing its predecessor outright.
The sections, and how each one earned its place
Jimi's left rail is a running ledger of the problems we had, and a beginner's needs, plainly. Each tab exists because something needed it, and a few exist because a thing we tried didn't work the first way.
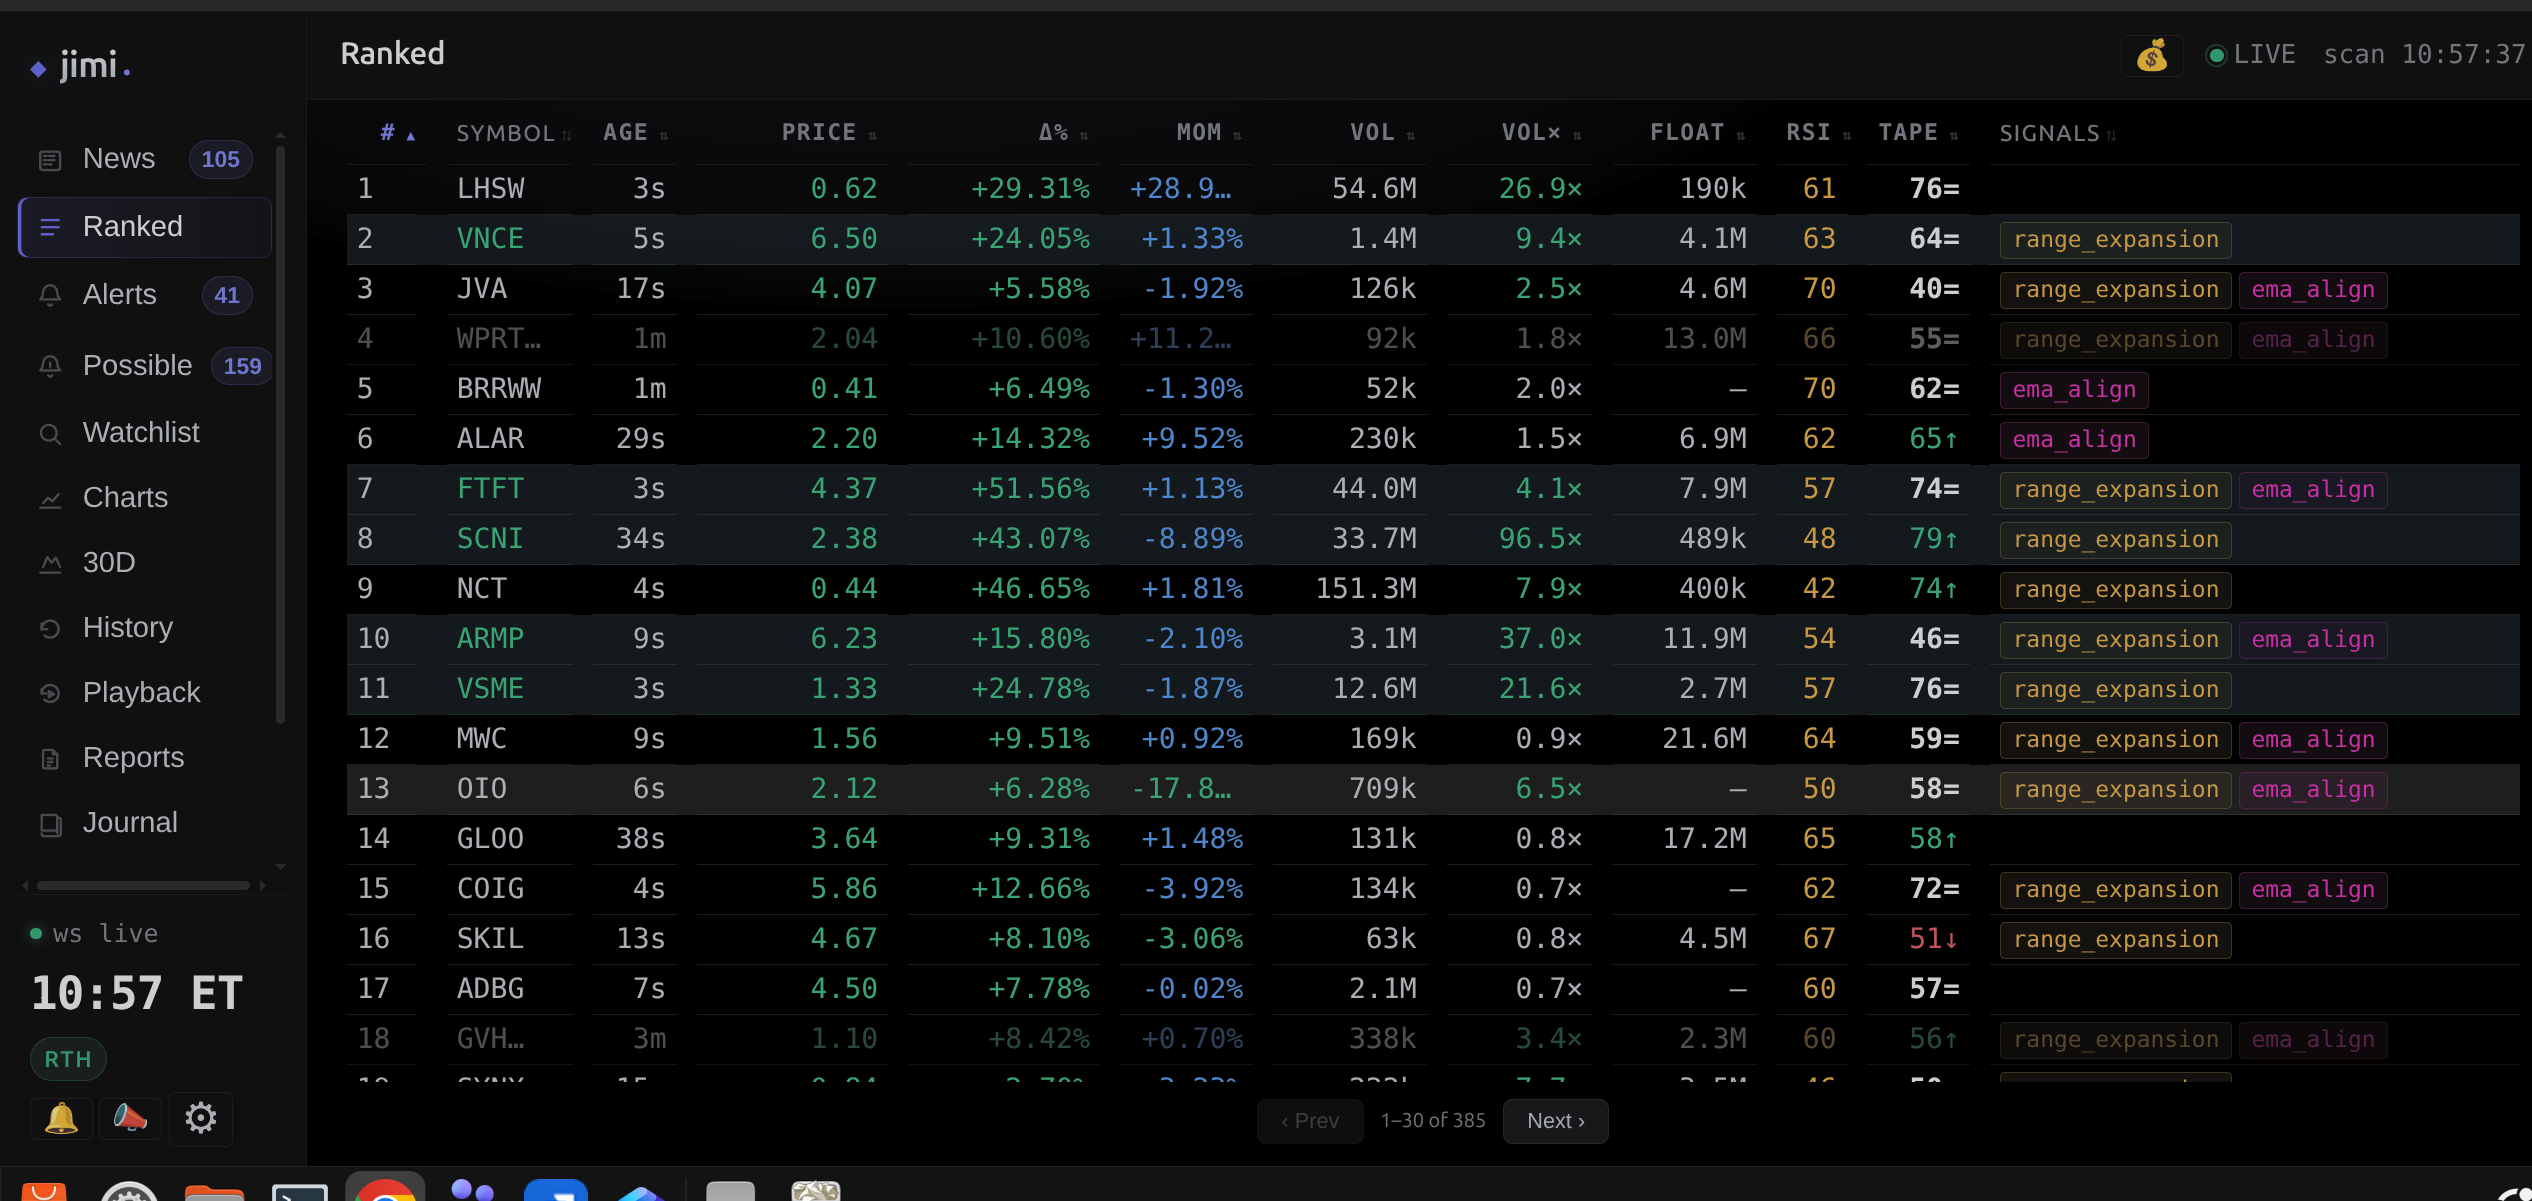
- Ranked: the scanner's output, a dense table of symbols scored on momentum, volume, float, RSI and tape. It started as a single list and grew columns as we learned what mattered (float was a late but important addition).
- Alerts: confirmed signals with severity, a Volume column we fought for, and note chips. We split alerts into confirmation vs. watch because the two had very different trust levels.
- Possible: a separate tab for pattern-based watch signals (like the "possible" green-candle momentum pattern) so they'd never masquerade as confirmed moves. Splitting this out was a deliberate adjustment after studying how the two classes of signal differed.
- Watchlist: the symbols you're following, kept separate from the full universe scan. It persisted its own state after the naive version kept losing it on reboot.
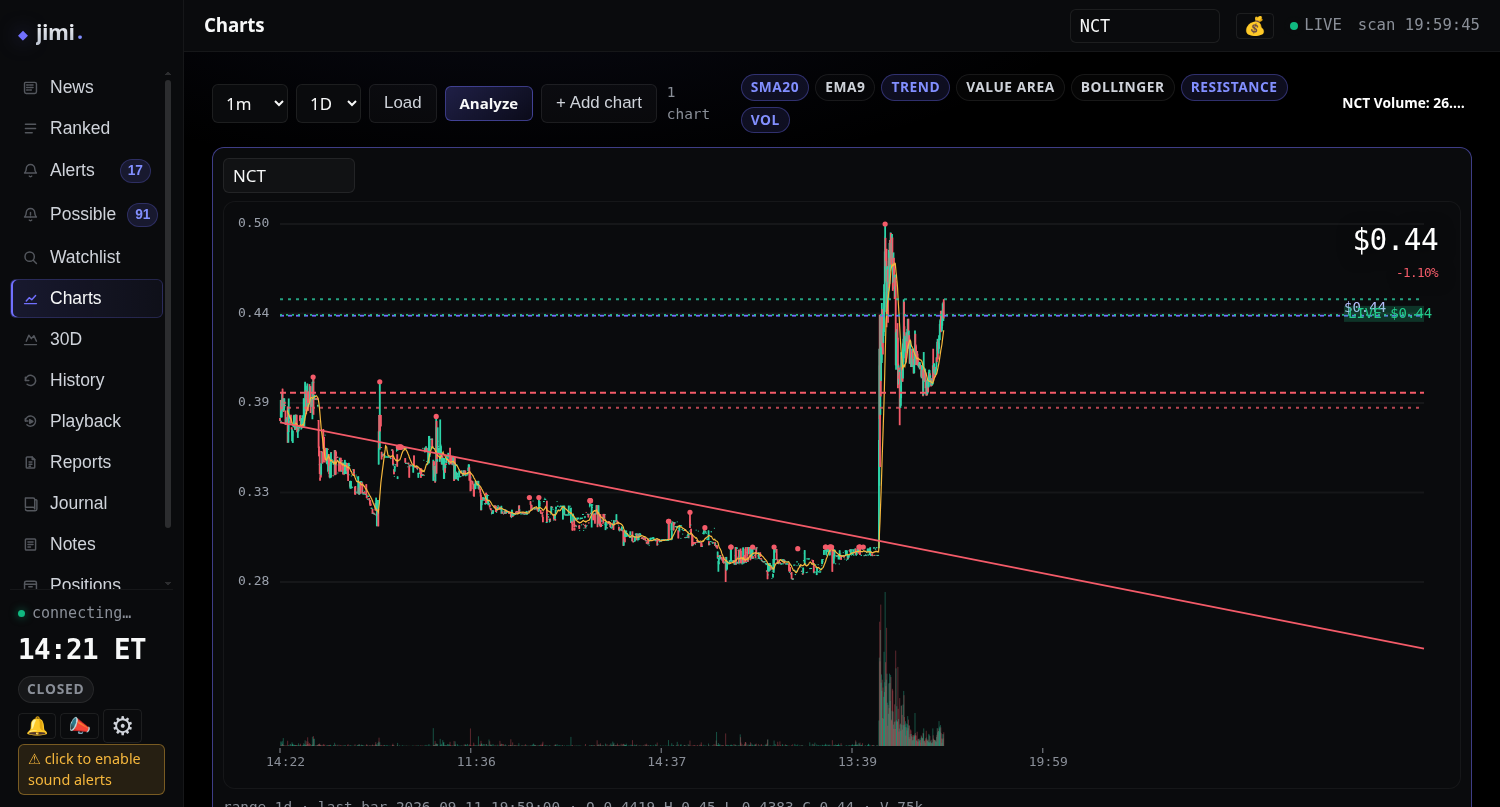
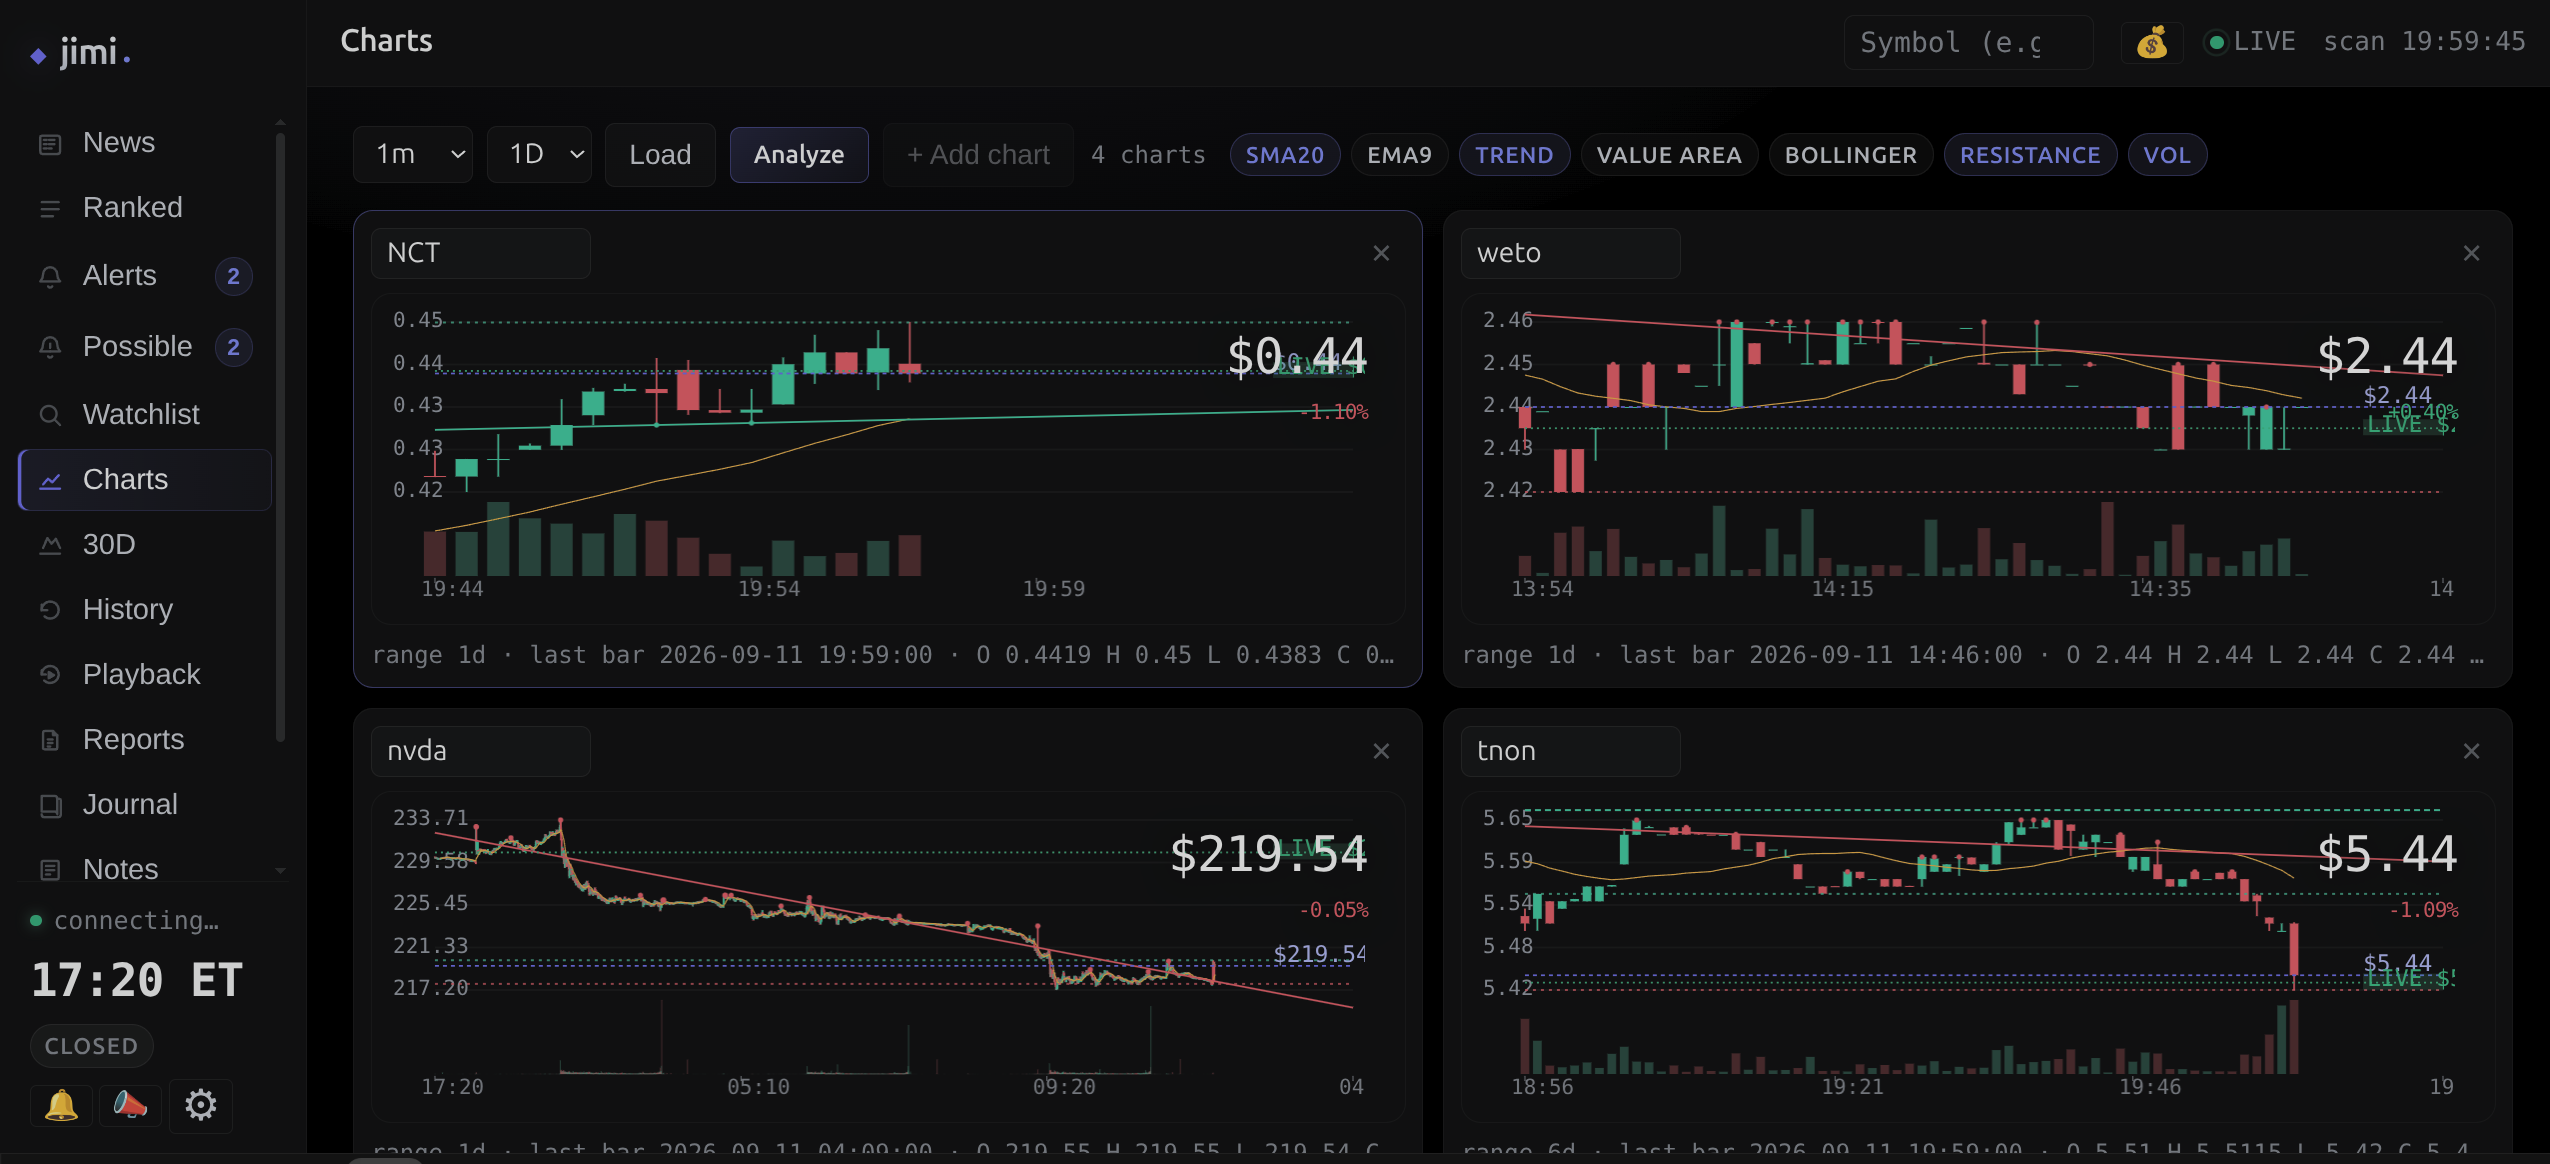
- Charts: candlesticks with SMA/EMA, trend lines, value area, Bollinger, intraday support/resistance and volume. It took three rounds of polish (drag-pan, zoom-stays-where-you-dragged, axis labels) before it felt right. Today we run it in a multi-chart grid so a novice can compare a handful of names at once.
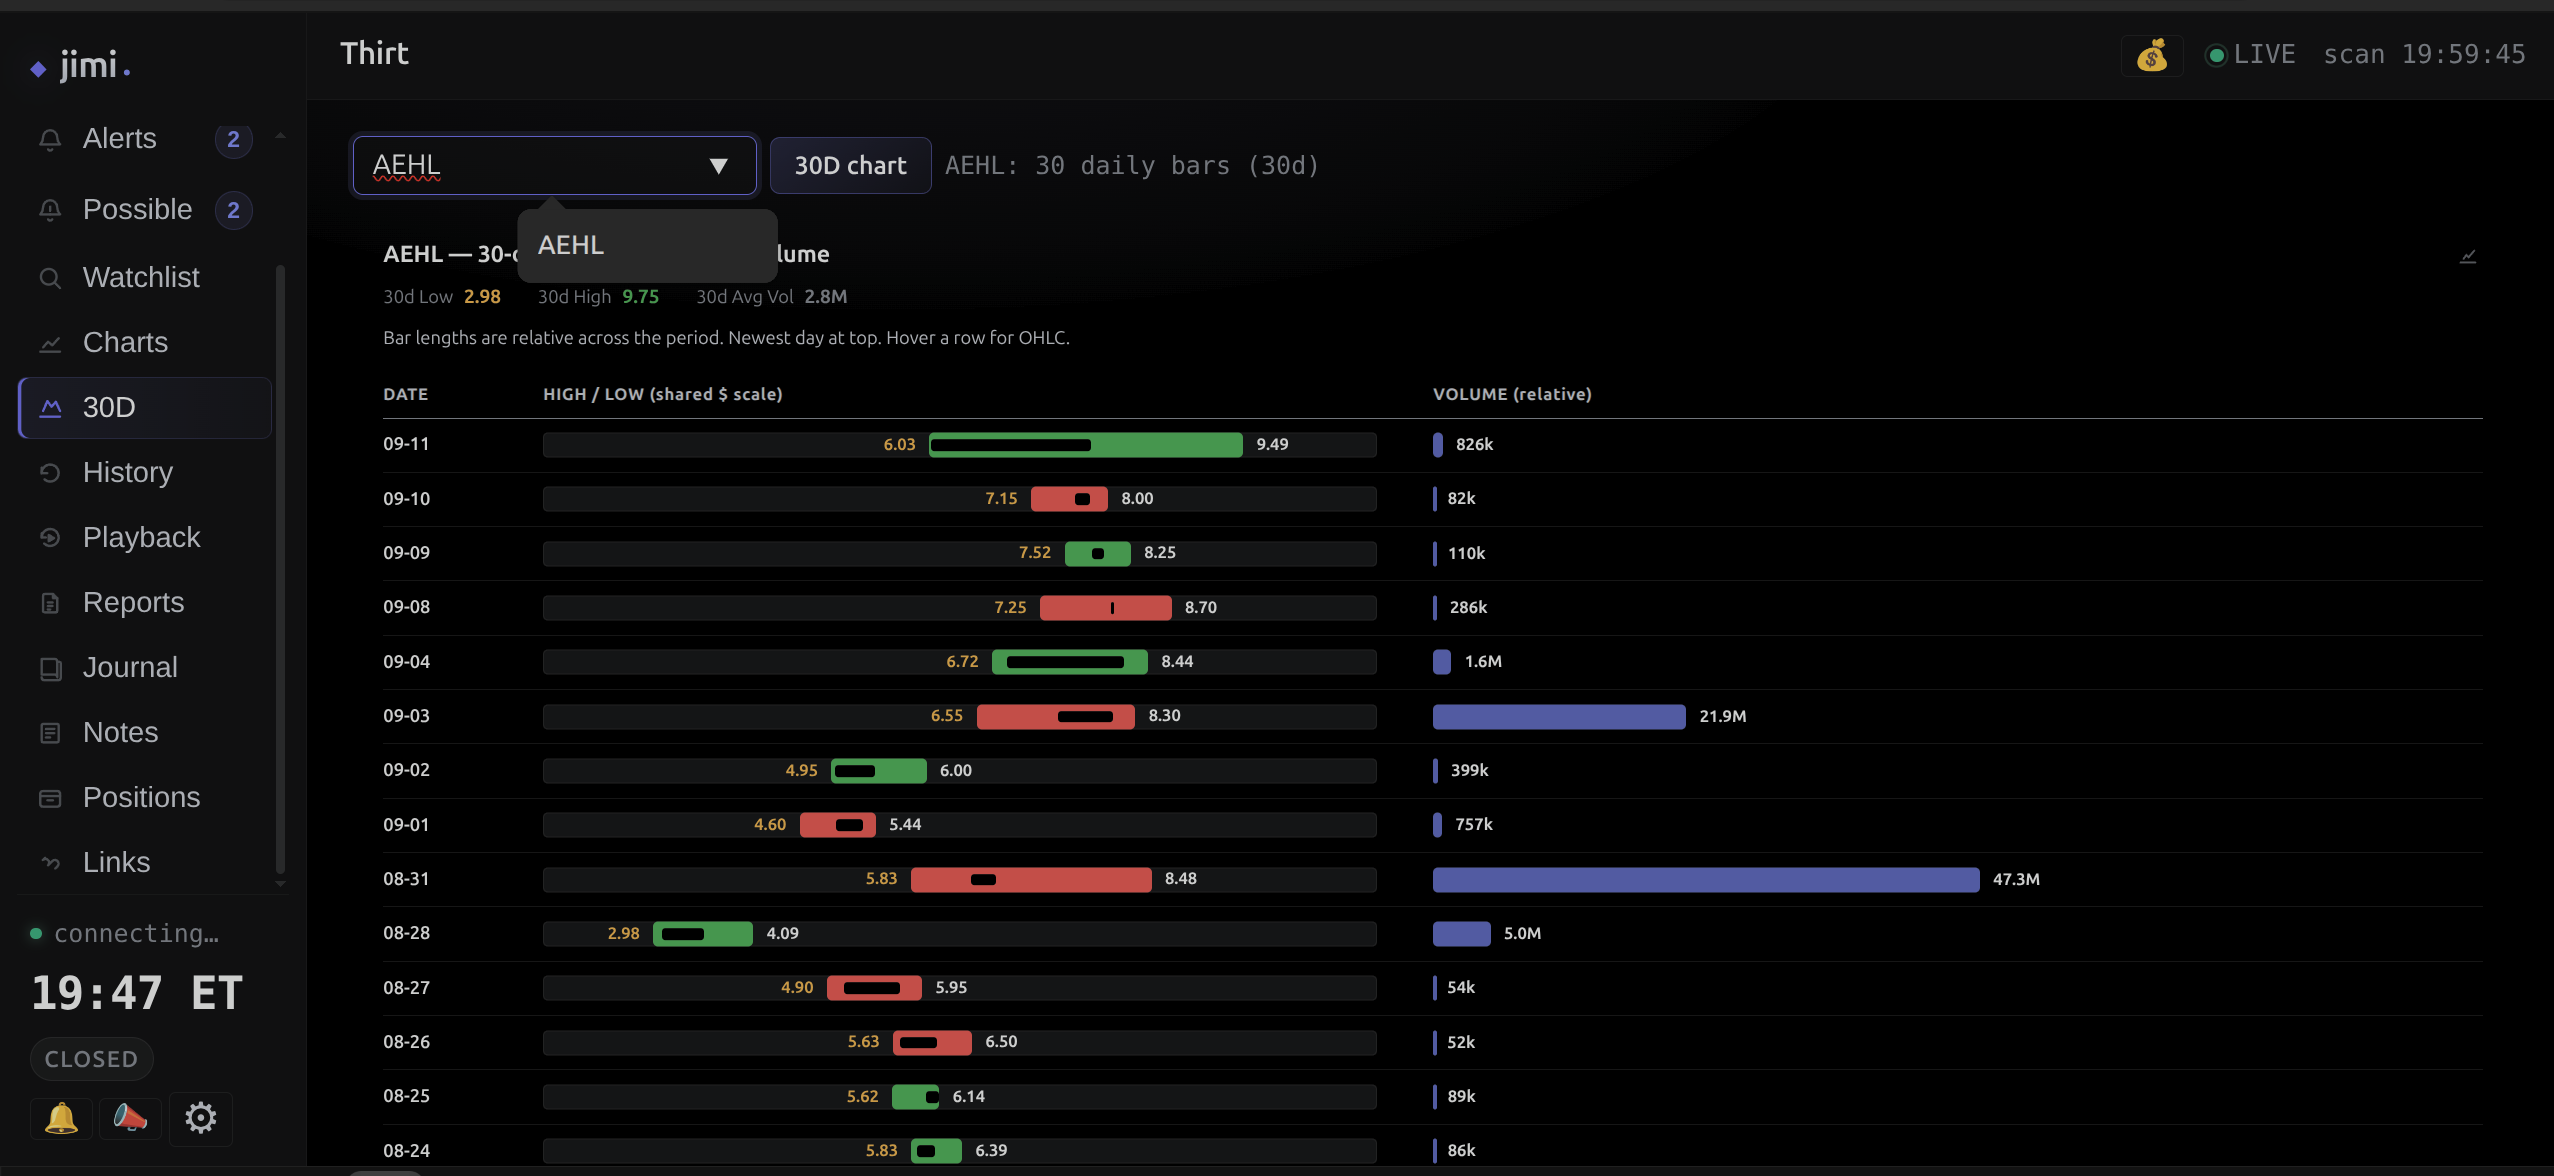
- 30D: thirty-day history for the bigger picture, which for a beginner is where "is this a real pattern or a one-day fluke?" finally gets answered.
- History: searchable 24h alert history, for after-action review.
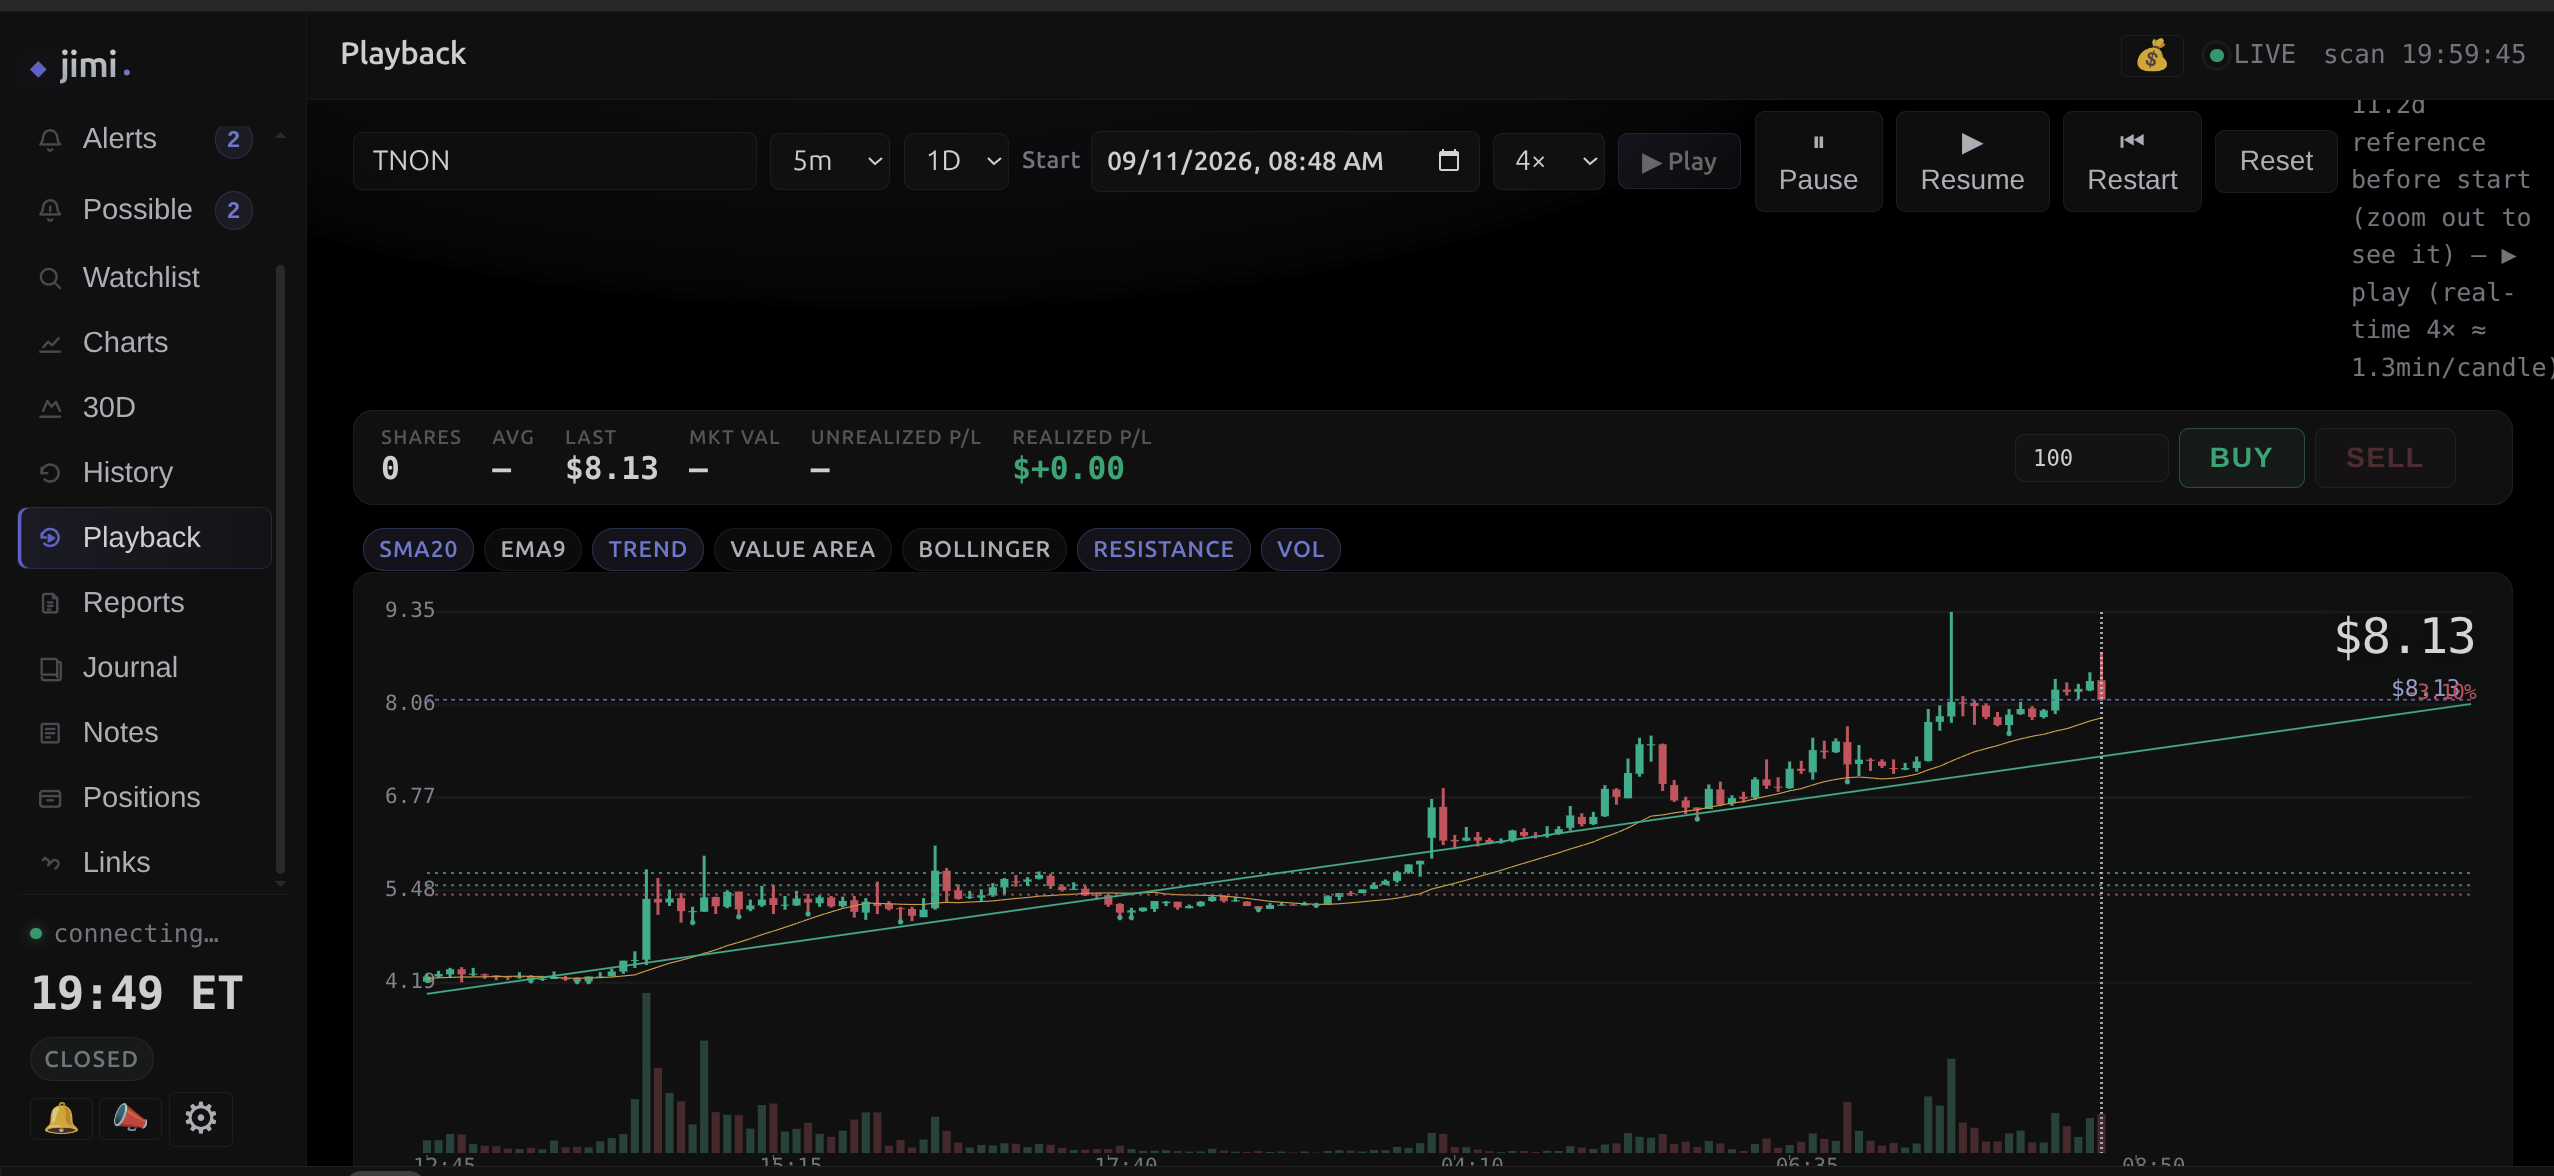
- Playback: replay the tape, for studying what happened after the fact. This is a novice's classroom: watch how a real move unfolded, without paying for it.
- Reports: the weekly research output, which we'll come back to.
- Journal and Notes: personal process. The Journal holds the running narrative of trading decisions and the reasoning; Notes is freeform scratch. Both are private, process-level tools, not display data.
- Positions: open and closed trades. Today it's the full buy/sell pair history with per-pair P/L, a significant upgrade from the initial minimal view.
- Links: handy references.
That's fourteen names in the rail. Each one was a ticket, a decision, and usually a battle against an earlier naive version. For me, the rail is also a map of the questions a beginner learns to ask — which is, in a way, the point.
The views a beginner lives in: 30D and Playback
Two of Jimi's views did more for my learning curve than any single alert, and both are things you only appreciate once you've been burned. The 30-day view renders every session's open-to-close range and volume as horizontal bars (newest day at top) so a single glance shows whether a name has been building, chopping, or blowing up. For anyone new to this, it replaces the urge to chase a single green candle with the habit of checking the bigger picture first: a stock can spike on Tuesday and still be inside a month-long downtrend.
Playback is the classroom. It reels a symbol back through real market sessions at up to exchange speed, re-running the tape on a 5-minute chart while the indicators redraw as if it were live. Want to know what a genuine pullback-and-bounce entry looks like when it starts to work? You don't have to sit and wait for one; you replay dozens of past sessions for free and study the anatomy. That's exactly the reps a novice needs but can't get from a live feed alone.
Both views share the same indicator engine as the live charts (SMA/EMA, trend, value area, Bollinger, resistance, volume) so what you learn in playback transfers directly to what you see in real time.
Which alerts proved worth it, and which didn't
This is where the "devil is in the details" really lives. We didn't just build alerts and hope; we studied them statistically and kept the ones that worked.
We ran after-action analyses on every alert, pulling candles 90 minutes after each fire. The results sorted themselves:
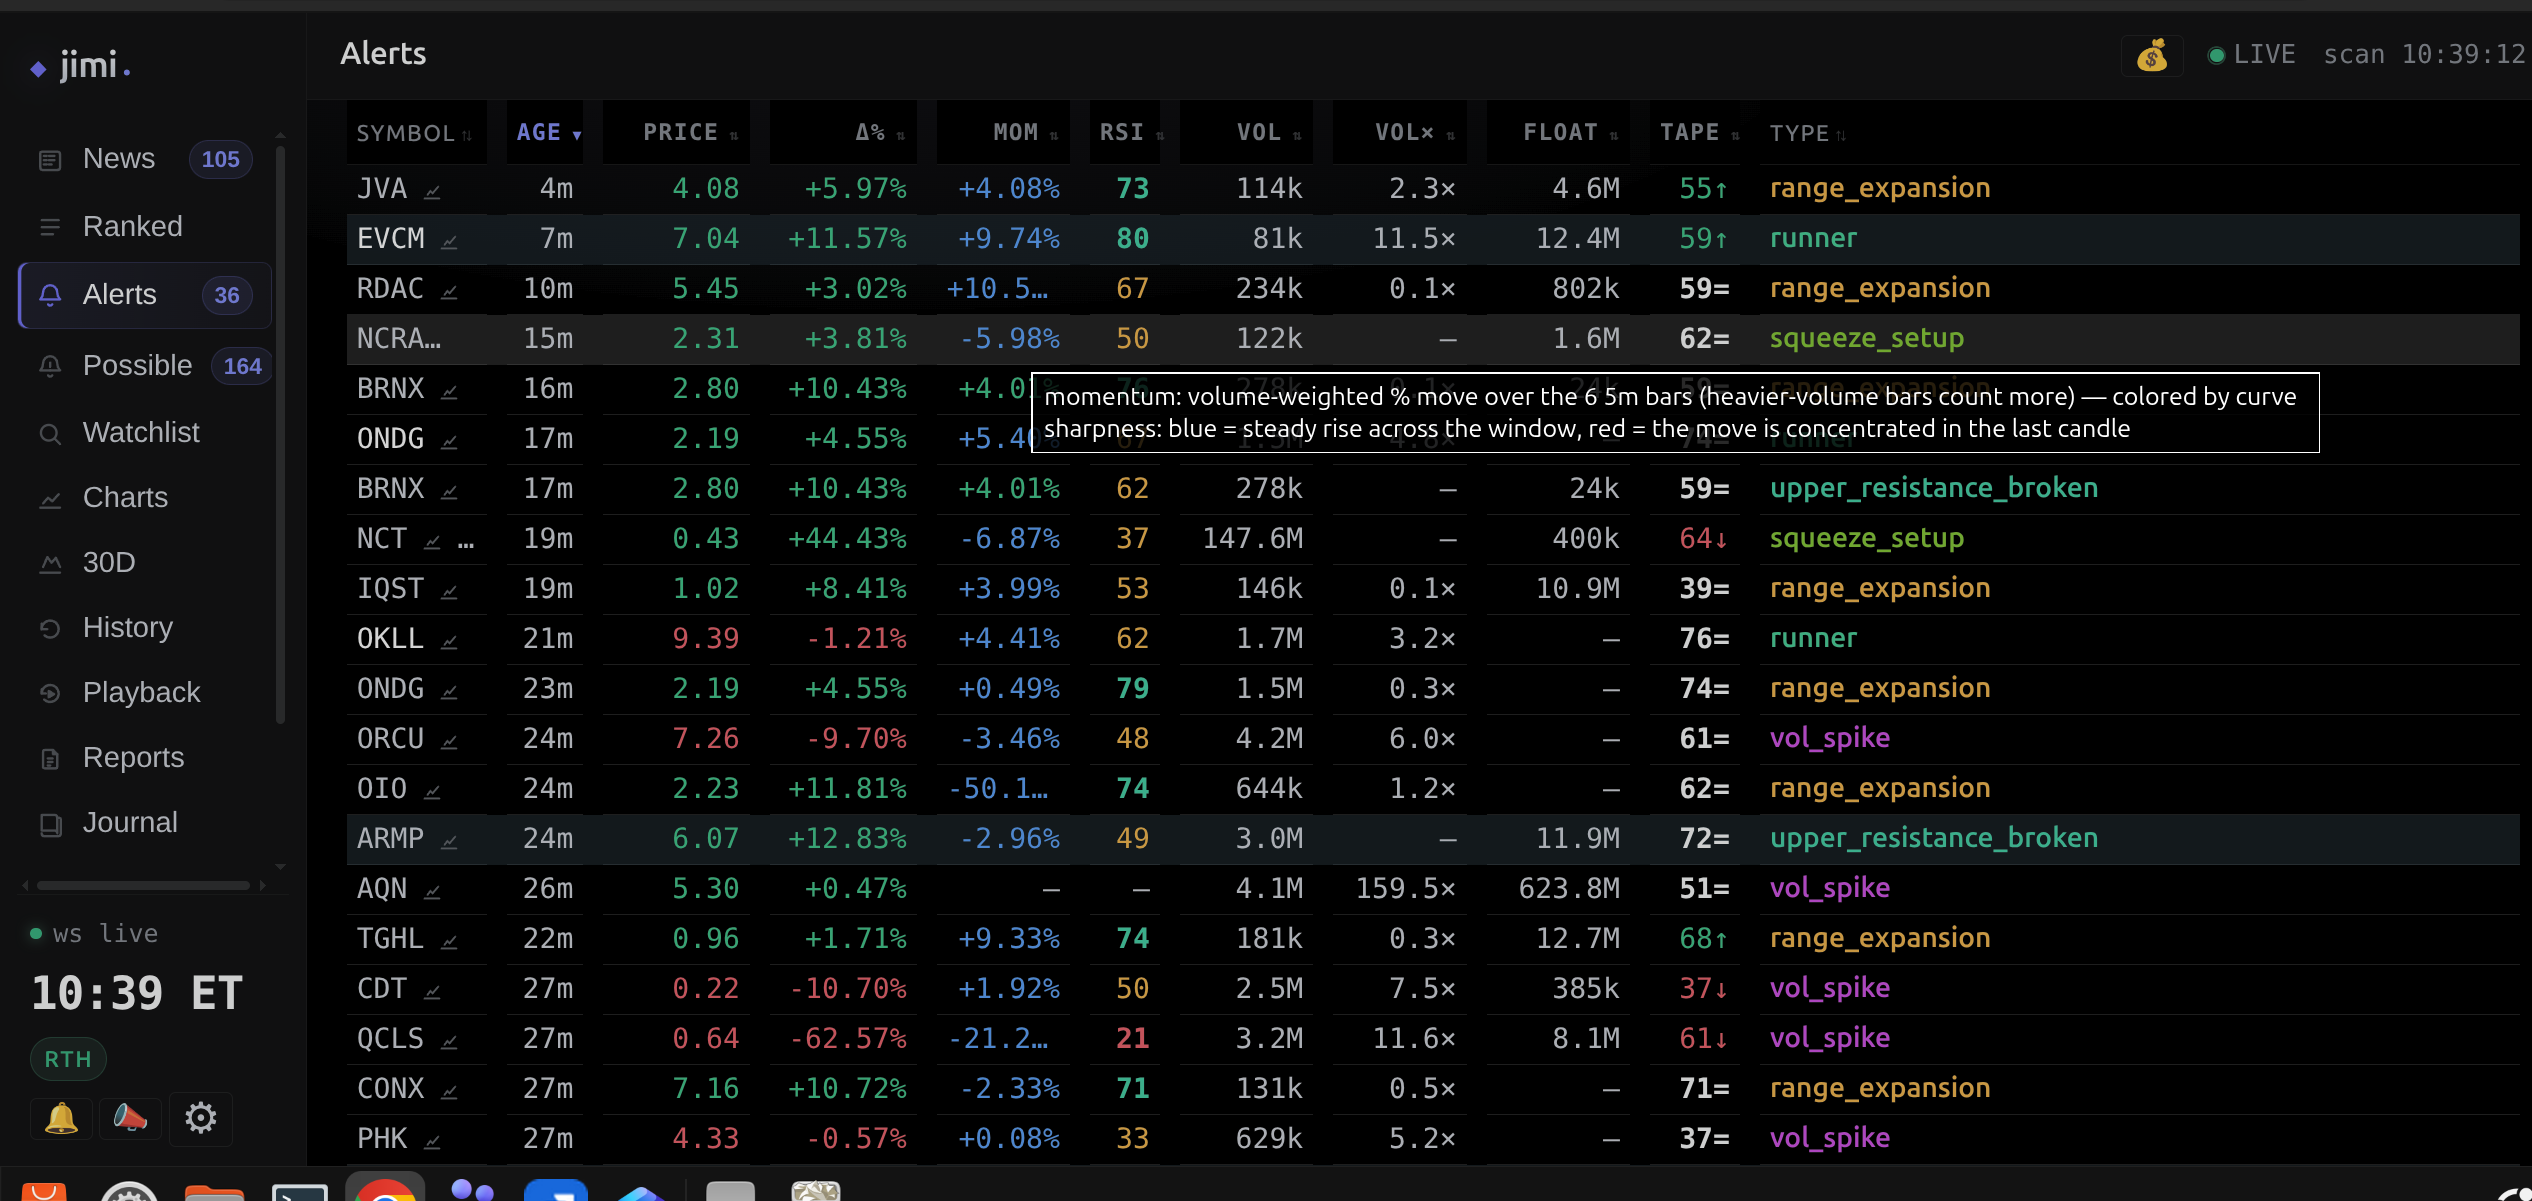
- upper_resistance_broken was the standout, a genuine breakout signal that produced the biggest 90-minute moves (one name +49% after it fired).
- range_expansion earned its place (one +26% follow-through), and the research told us why: a 5m bar spanning ≥2% of the day, early in the session, flags a name about to be in play.
- squeeze: our newest detector. Overnight it screens names that are structurally set up to run (low float, enough average daily volume, a fresh catalyst) then watches the tape for the squeeze to pop. When one fires, Rupert tells me in plain English over the speakers the moment it happens.
- big_mover looked impressive but as a category had terrible follow-through. Most fizzled or reversed. We didn't delete it; we demoted it and split out cleaner, research-backed setups like premarket-runners.
- possible fired a lot and barely moved the needle on average, which is exactly what a watch signal should do. It's a "get me to look," not a "buy now," and the stats confirmed that misreading it as a trade signal would be a mistake.
- macd_turn and stair_continuation were weak — low follow-through, we consider them noise.
The blunt summary that fell out of one weekend of research: the system as built only got within minutes of about 2% of real big moves, but a single research-backed condition (a 2% range bar before noon) would have flagged 57% of them. That one finding reshaped the alert landscape. It's why the Possible tab and the expansion_watch signal exist. For a novice, the lesson is quietly profound: alerts are not trade signals. They're a prioritized list of what to look at, and the useful ones teach you what to ignore.
Weekend research and after-action reviews
With a day job and a market that only trades five mornings, the weekends are where the real work happens.
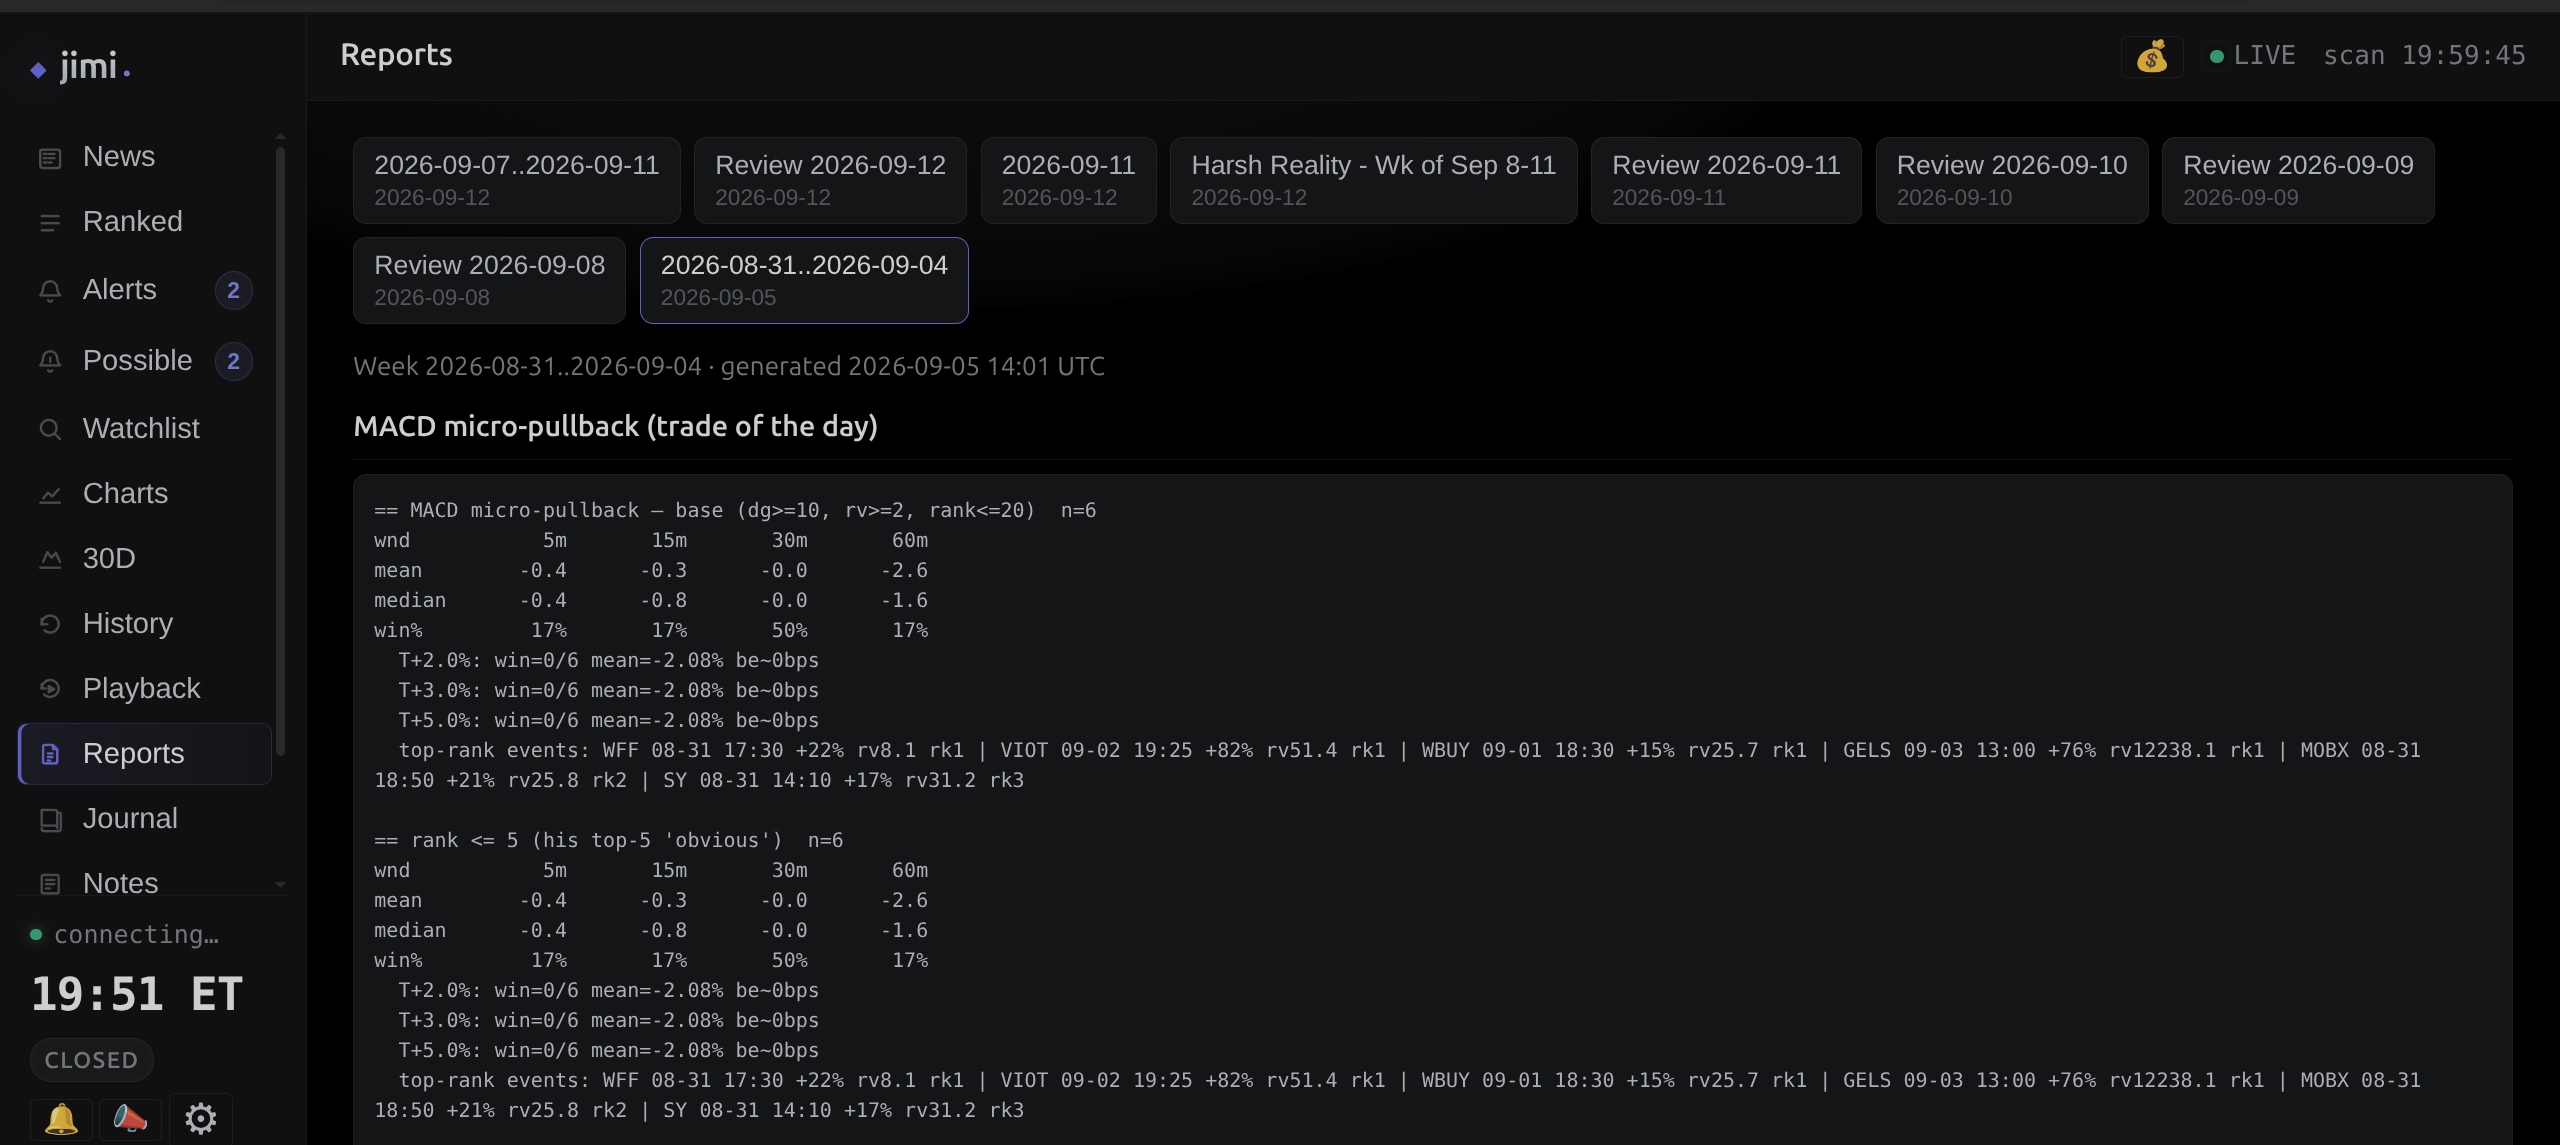
Weekend statistical research is a fixture: we pull training panels of 5-minute bars (tens of thousands of rows, then out-of-sample days the research never touched), compute forward big-move probabilities, and screen conditions. That's how we found the expansion-watch edge, a condition that predicted a 30-minute +3% move about 4.5x better than base rate, verified on out-of-sample data before we ever shipped it. Nothing deploys from research until it survives out-of-sample validation.
After-action reviews are the discipline that turns trading into learning. Post-alert analysis checks what happened 90 minutes later and scores every alert type without mercy. The weekly report rolls the week forward, and each alert family gets a verdict: keep, tune, or retire. Research ekes out new setups (squeeze-eligibility screens, runner exit studies) and validates them against as much historical tape as we can muster. It's slow, methodical, and it's how a mostly-AI-fed signal stack stays trustworthy. For someone still learning the ropes, a report that tells you bluntly which of your setups lost money is worth more than any boosted alert.
Position sizing: the tool I wish I'd had first
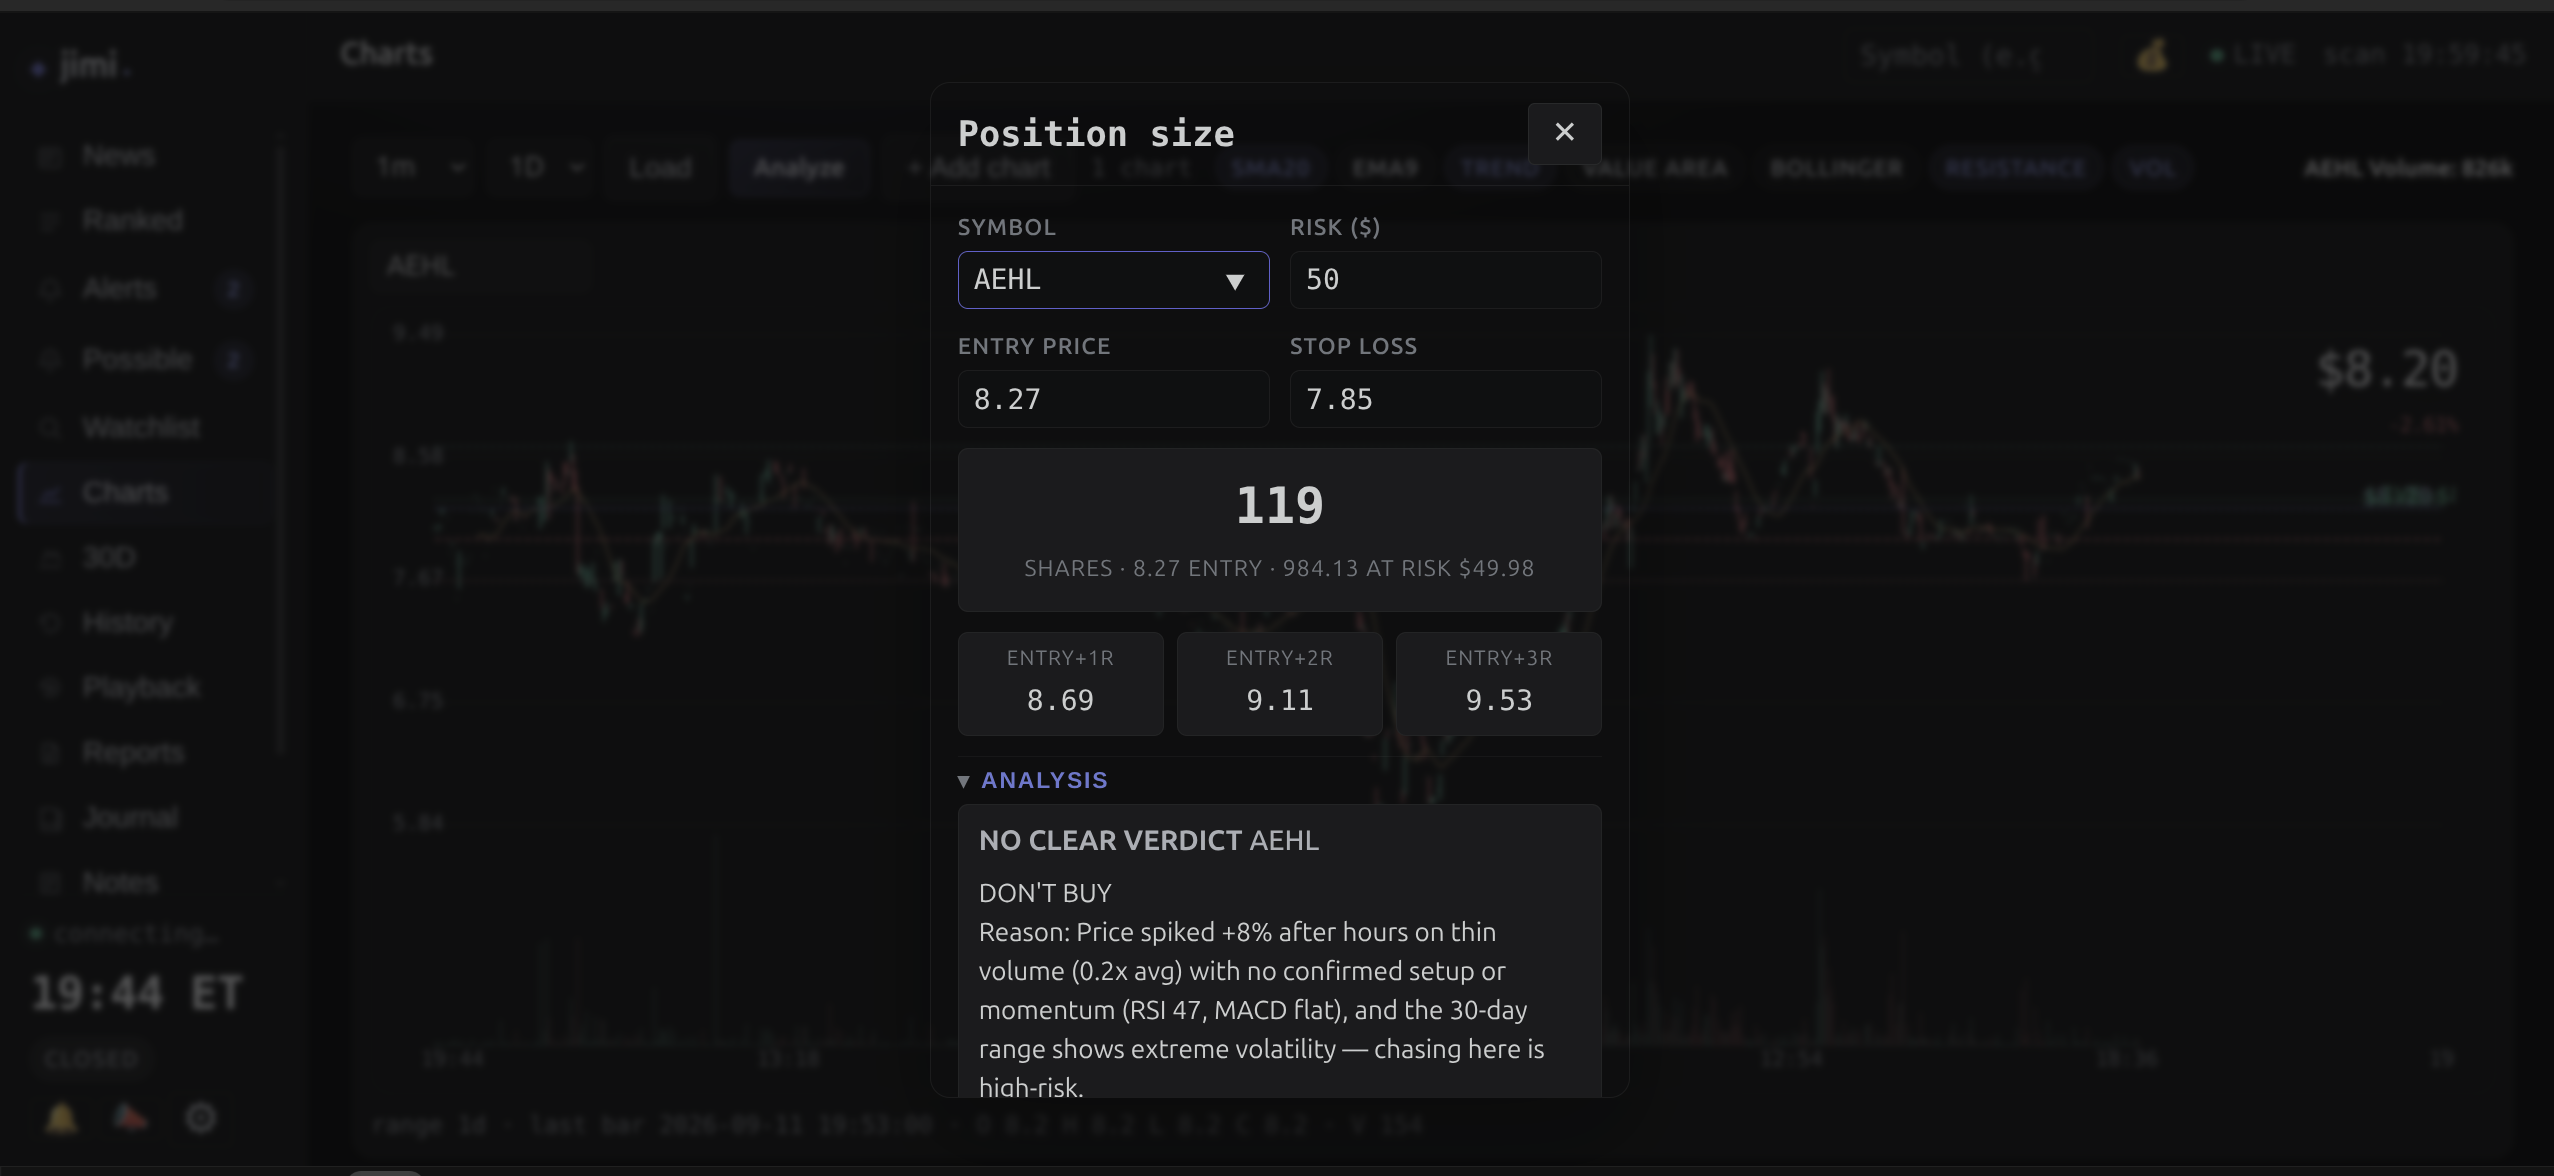
The position-size calculator is a favorite. Click the icon in the top bar and it opens a modal that:
- Auto-fills the chart symbol you're viewing and pulls a live entry price (or last close for names without a live tape).
- Defaults a stop (5% down on pricier names, 10% on penny stocks), keeps it editable.
- You set your risk, and it computes shares, entry, notional cost, at-risk dollars, and the 1R/2R/3R price targets.
Then it goes a step further: it kicks off a background deep-analysis of the ticker and renders a BUY / DON'T BUY verdict with the full reasoning, factoring whether the setup is a runner, a squeeze, or a pullback bounce. Risk-based sizing folded together with setup classification: that's the difference between "this symbol looks hot" and "here's a number of shares sized to how much I'm willing to lose."
This is the single most important novice tool in the app, and I mean that literally. New traders think in terms of "how many shares can I afford." The right question is "how much am I willing to lose on this idea", and the tool works backwards from there. In the screenshot, a $50 risk with an $8.27 entry and a $7.85 stop resolves to 119 shares and about $984 at risk. And the analysis panel still had the nerve to say DON'T BUY, because the setup wasn't there. That refusal to flatter you is exactly what a beginner needs.
Catalysts, settings, and the listening assistant
Catalysts matter. A technically perfect setup on a stock with no news is a different animal than one with a fresh catalyst behind it. Jimi pulls news with sentiment and impact scoring, and the deep-analysis prompt feeds the catalyst in as context. It also gatekeeps squeeze-eligibility: overnight, a screen joins float, average daily volume and a fresh-catalyst flag into a watchlist of names that are structurally set up to run.
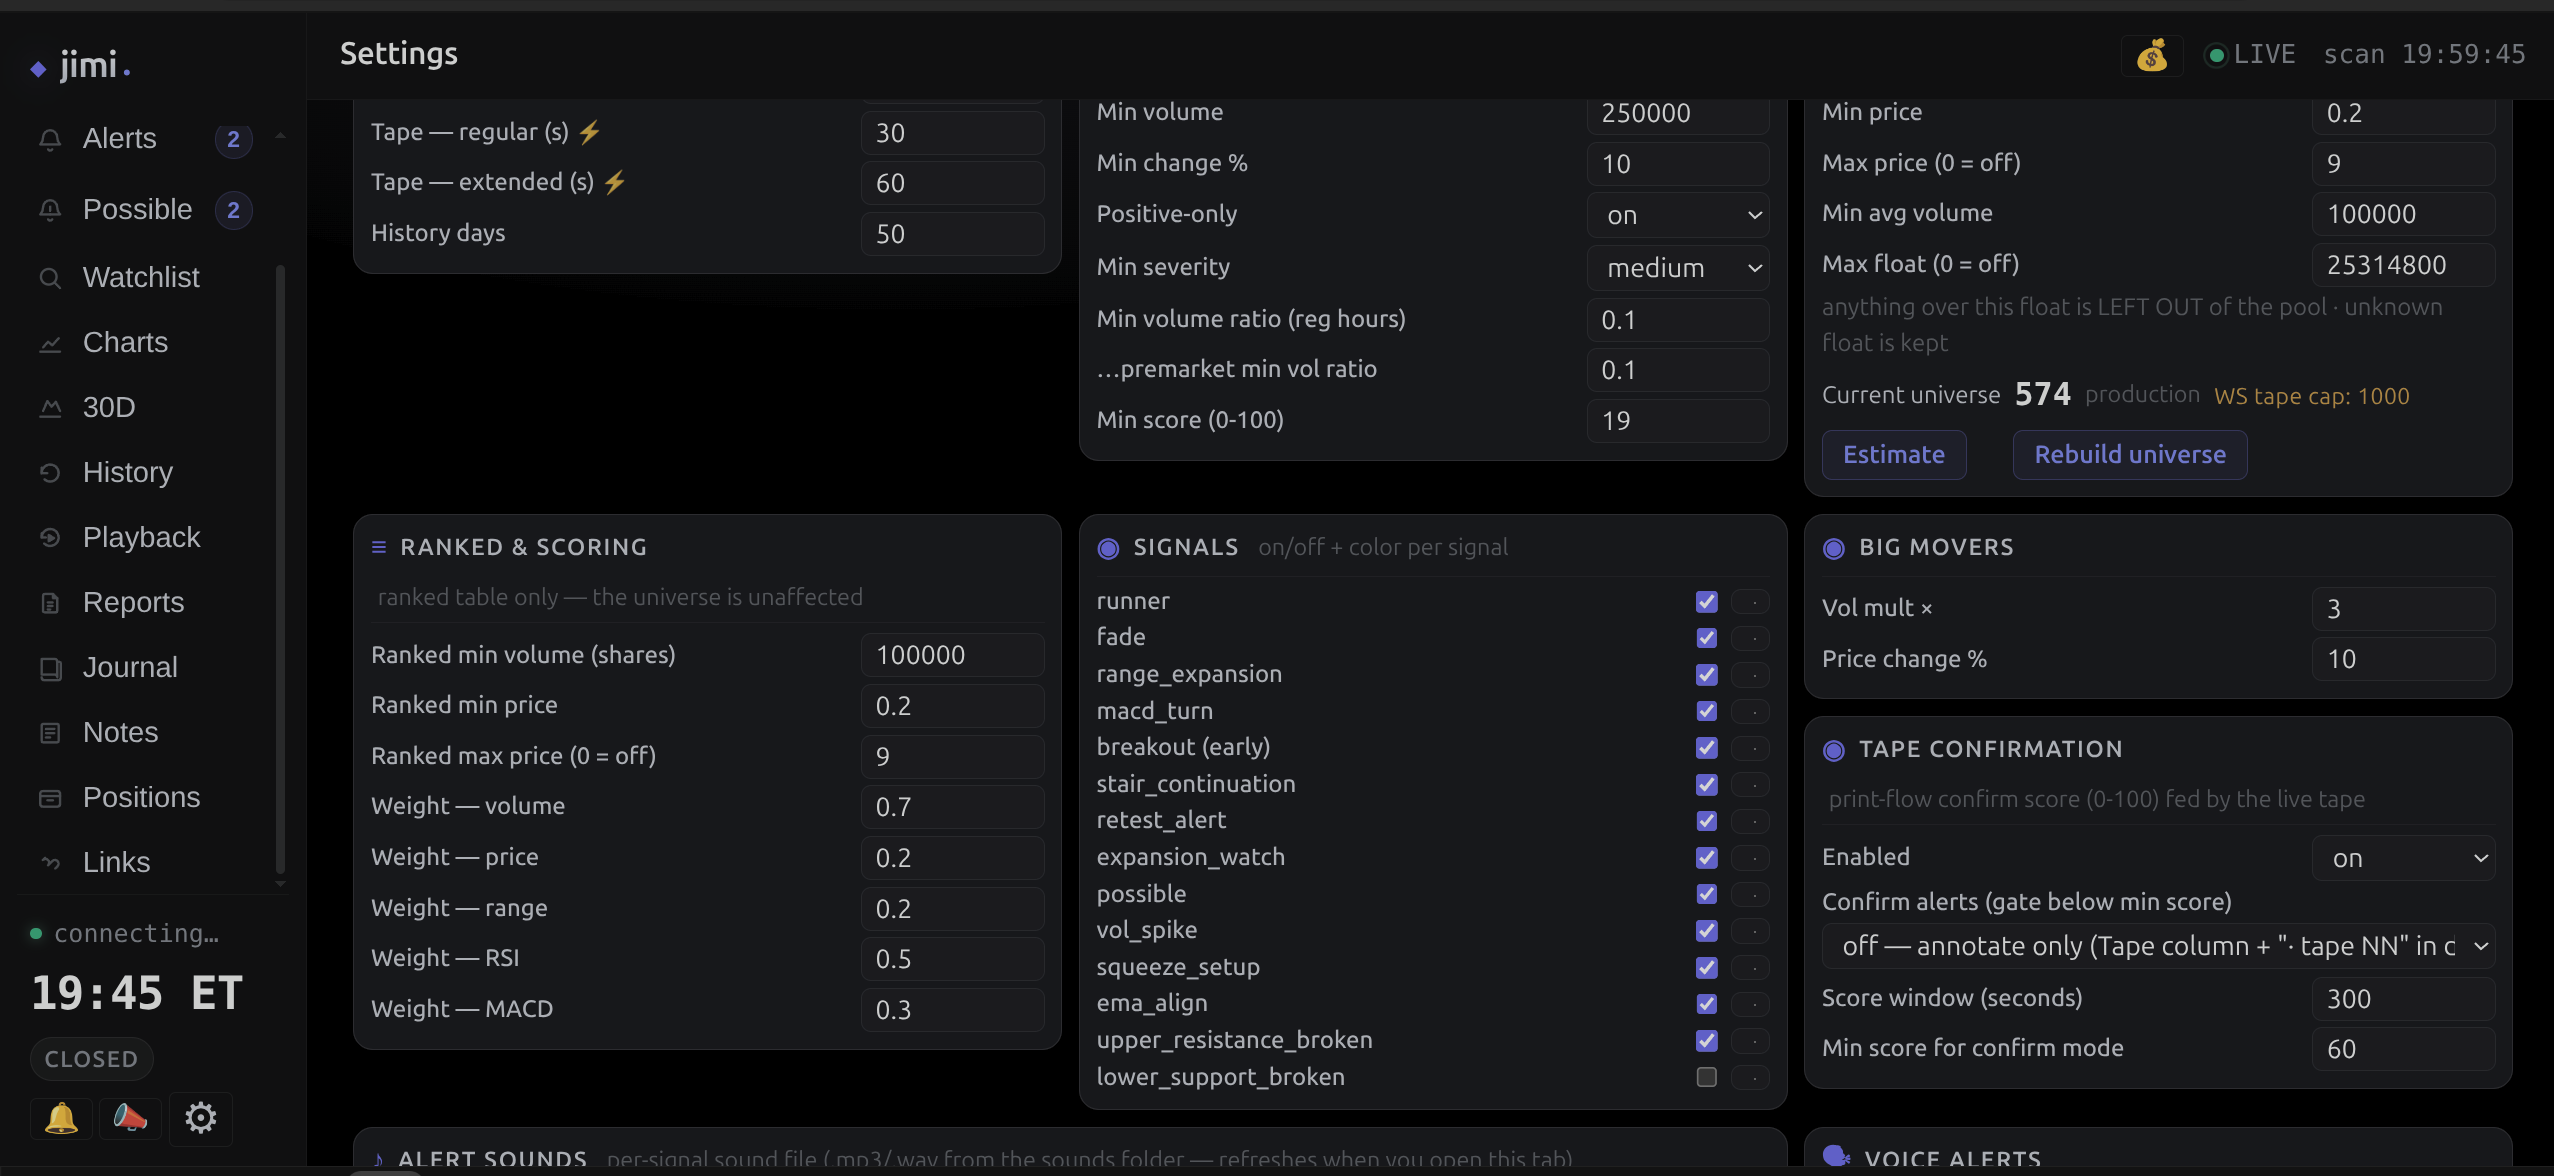
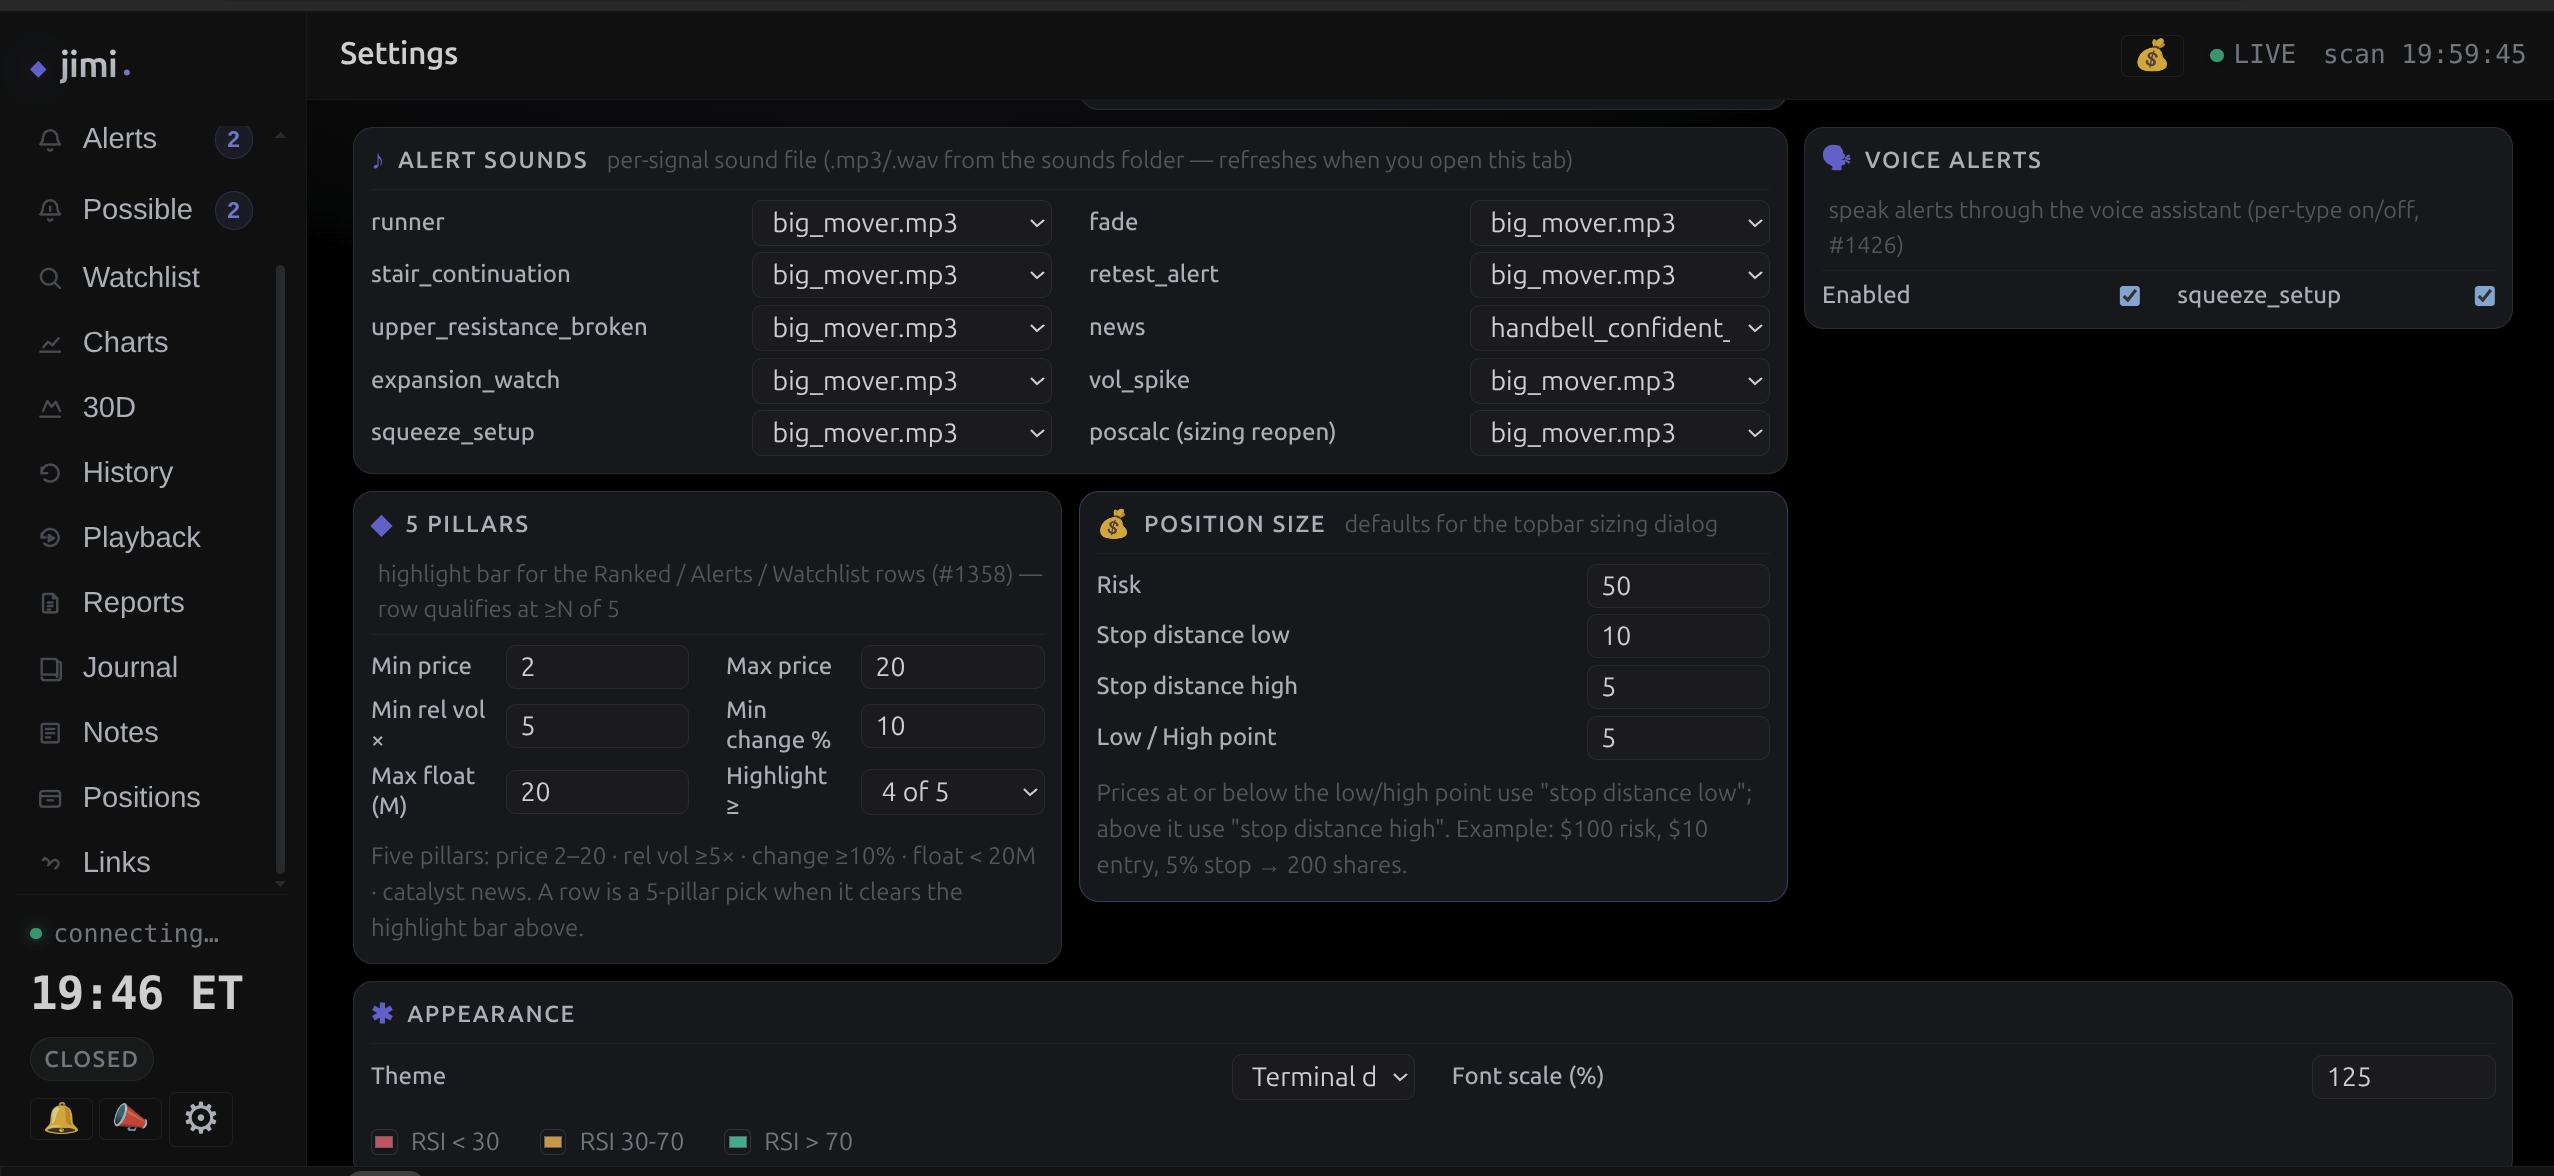
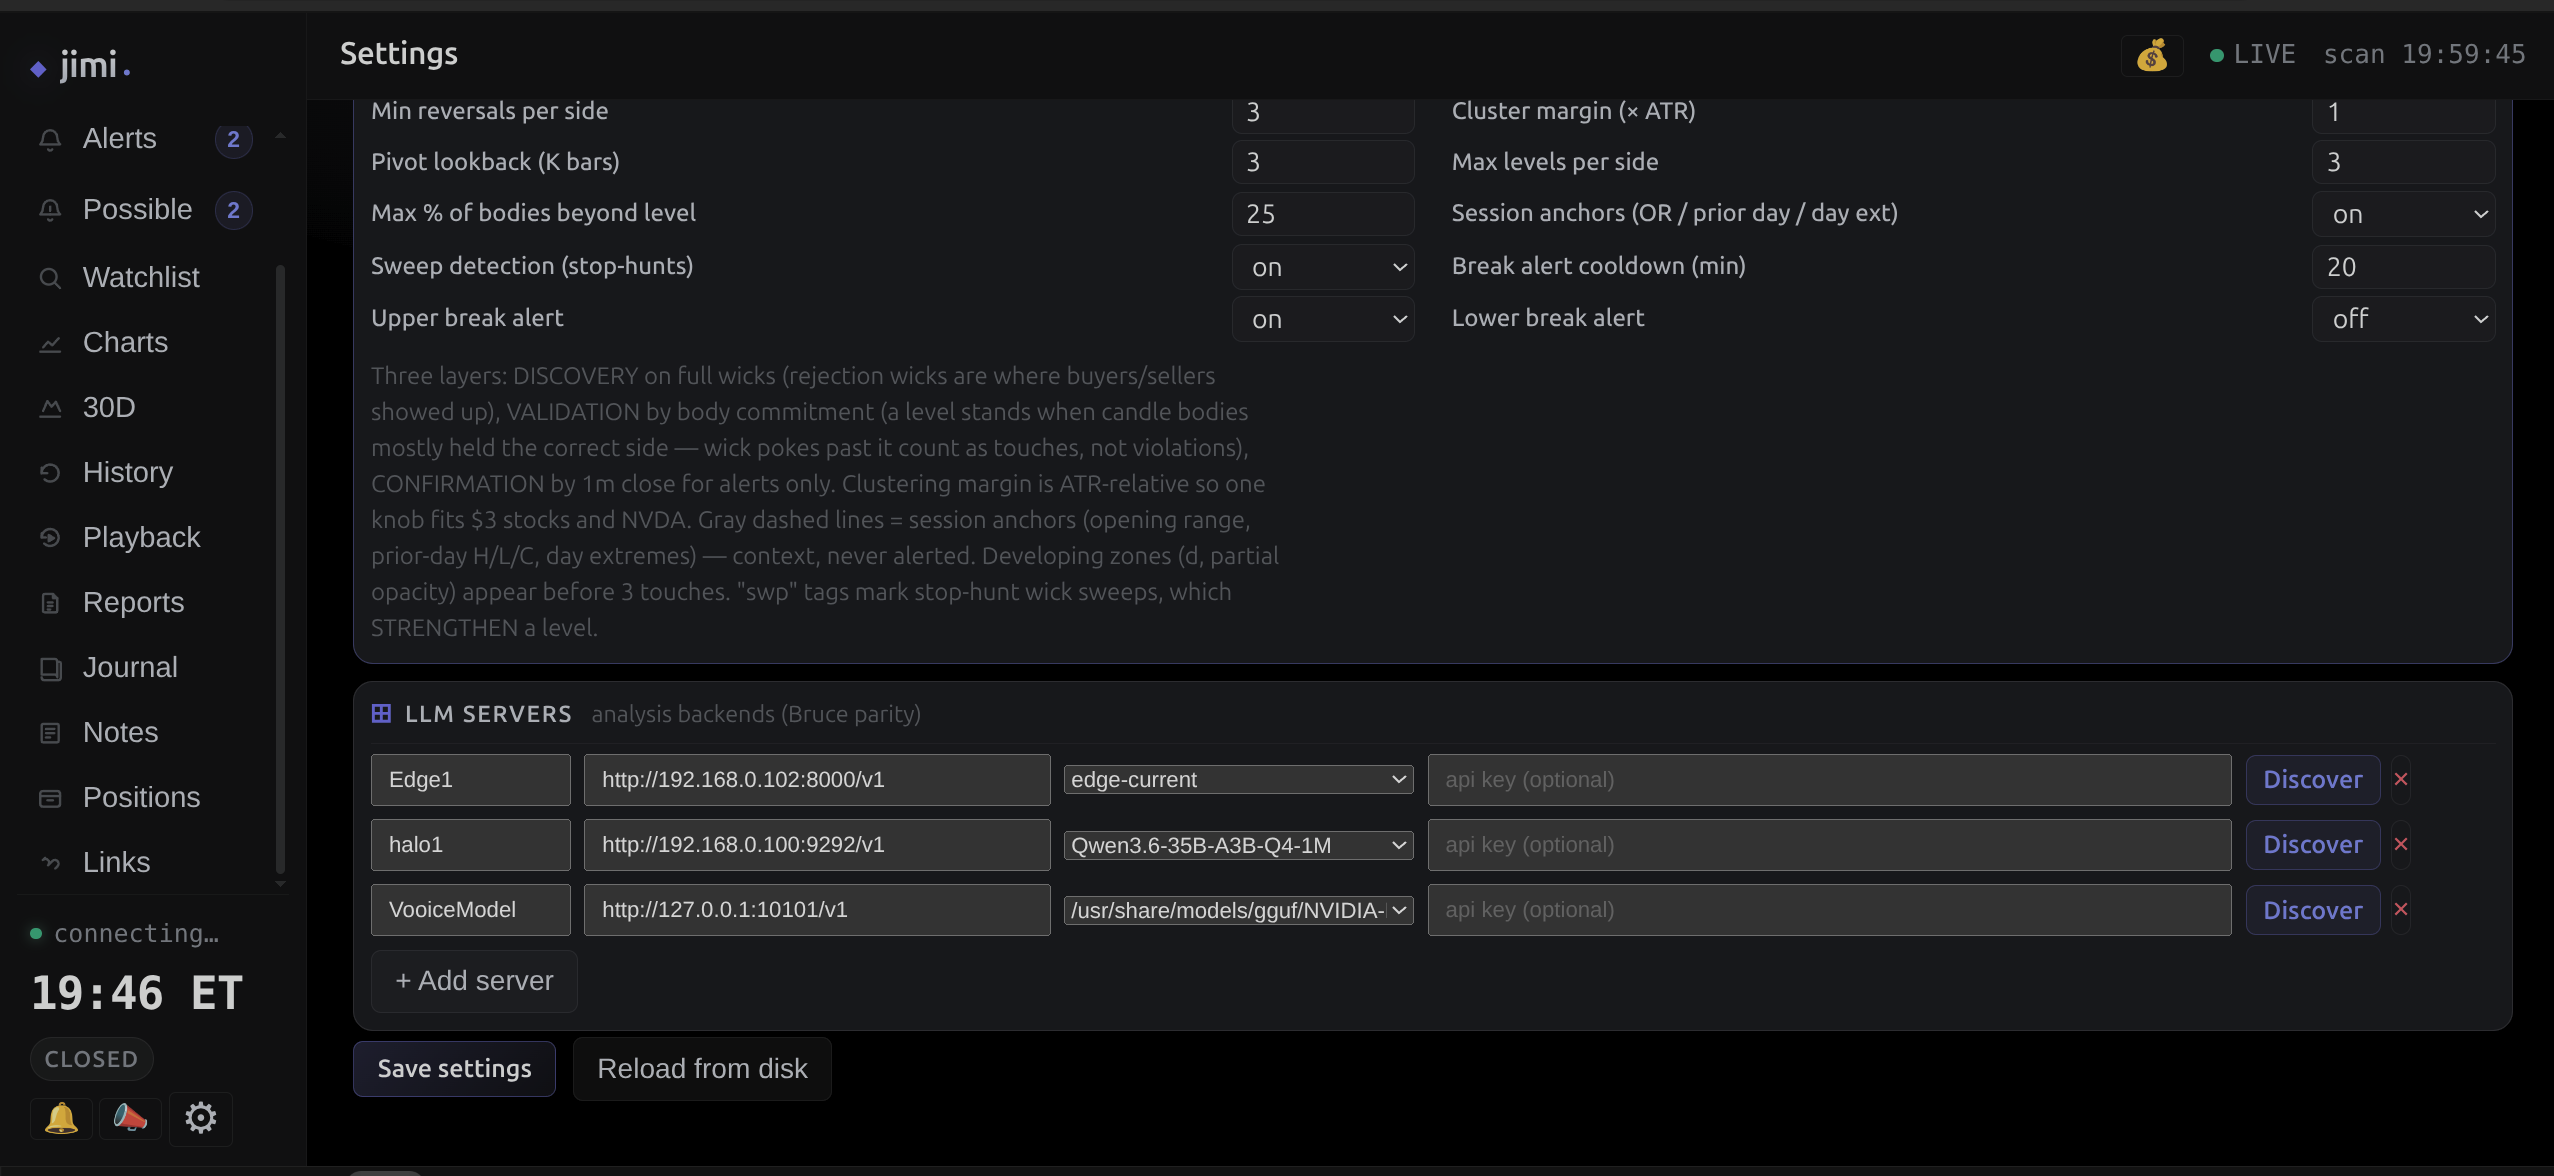
The Settings screen is a study in how live-tunable trading software should work. It's organised into compact tiles: scan and feed settings, thresholds, universe rebuild with a ticker-count estimate, and the five-pillar highlight thresholds for the row colors on Ranked/Alerts/Possibles/Watchlist. Values change live, applied server-side so the feed respects them at the source rather than as a client-side afterthought. We learned that lesson the hard way when filters silently failed to gate alerts. The screenshots below walk through the three settings tiles: the scanner universe and scoring weights, the alert sounds and five-pillar highlight rules, and the level-building logic that decides where resistance and support live, with the LLM servers that power analysis on the same pane. Because inference servers are configurable in Settings, the model stack is a deployment choice rather than a hard-coded dependency.
And today, the assistant (Rupert) learned to talk back. The deep-analysis now routes to the voice-assistant model server (a fast local voice model) instead of round-robining to slower inference boxes, analysis calls went from intermittent 15-90 seconds down to a reliable 3-10 seconds. The same project that scans the tape now has a voice lane woven into it. When a signal matters (like the new squeeze detector firing) Rupert announces it in plain English over the speakers, so the market isn't just something I check on a screen; it talks to me. It's a small change on the surface and a surprisingly large win in practice.
What the whole thing taught me
The mundane truth about production software is that it goes wrong in the boring places — a timestamp that means something different at 2am, a state file two processes disagree about, an alert you trust that the numbers quietly say you shouldn't. The fix isn't edge cases; it's making the system fundamentally truthful about what it knows and when it knew it.
Jimi encodes that truthfulness as architecture: computed freshness, refused stale data, a pure scanner, one transactional store, canaries that watch the meta, and a discipline — the RELIGION — that writes every lesson down and makes the next iteration eat it.
And it's a reminder of what building something significant with AI by your side actually looks like when you're starting from scratch. It's not a blank page filled in for you, and it's not a replacement for learning the market. It's a partner who helps you be deliberate, thorough, and candid — who lifts the heavy, repetitive load of real engineering while you hold the design and the hard calls. As a novice, the greatest gift it gave me was a system that refuses to let me fool myself — and the reps to learn, in playback and after-action alike, before real money is on the line. When you hand a beginner software that insists on the truth, they stand a chance of becoming a trader who demands it.
None of Jimi is locked to this room, and that's deliberate: someday the goal is to make it available to others, not keep it jealously private. For now it's a lab project forged in the RELIGION, self-contained and built to be moved.
Written Saturday, from a desk in the lab, with the market closed and Friday's tape for company. No keys, credentials, or addresses appear here by design.
Revised 24 Oct 2026: a verbal tic, edited out. Revised 24 Oct 2026: punctuation and filler trim.— T.D. Brace & Rupert
Disclaimer: nothing in this article is financial advice of any kind. I am not a financial advisor in any way.
Comments
No comments yet.
Please sign in to comment. Create an account if you don't have one.