Searching for the perfect alert: the Jimi edge hunt
We set out to find a trading alert that would tell us which stocks were about to run. New to the market, we measured instead of hoped: three million rows, a grid of conditions, a walk-forward trap that caught us, and one small edge that survived. The perfect alert doesn't exist; small ones do.
We are new to the stock market. Not new to software — I've been writing code for decades — but genuinely new to markets, which is a different kind of new. And when you're new, the first thing you do is go looking for an edge: some signal, some screen, some alert that will tell you which names are about to run so you can be early instead of late.
This is the story of that search. We built a market watchtower (Jimi) that scans and ranks the whole universe, and then we spent weeks trying to turn the thing that watches into a thing that predicts. The candid headline is this: the perfect alert does not exist. But small edges do. Finding that out took real work: millions of rows, a catalog of false starts, and the discipline to believe the numbers over our own hopes.
This is what we found, how we found it, and what the search taught us about being beginners in a market that does not care how hard you're trying.
New to the market, looking for an edge
Here's the thing about being new: you don't yet know which parts of your plan are wise and which are just expensive optimism. We knew that. So before we let ourselves buy a single ticker on a hunch, we decided the safe thing was to measure. Build the scanner, collect the data, and find out what, if anything, actually moves before a name runs.
The tool we live in day to day, Jimi, ranks hundreds of names on momentum, volume, float, RSI and tape. It made sense to ask the obvious beginner question: is there a pattern in all that data (a combination of conditions) that reliably predicts a stock about to jump? If the perfect alert existed, it would be hiding in the bars.
So we went looking.
The data, and how we got it straight
We didn't want to build our strategy on vibes, so we built it on raw 5-minute bars: roughly 57 trading days across about 1,700 symbols, over three million rows. We pulled daily bars for two years for the same names, and hourly bars for the most liquid of them. All of it from free sources; all of it cached on disk, because our live systems are worth more to us than our guesses.
Two safeguards matter. First, we kept the delisted and short-history names in the panel: dropping them would quietly hide the losers and flatter every result. Second, we excluded 118 funny reverse-split days that would have looked like phantom 90% crashes. Garbage in, garbage out; we were careful about the garbage.
The search, in three stages
We ran the hunt as three escalating tests, each one trying hard to trip the previous one up. This is the core of how the whole thing went.
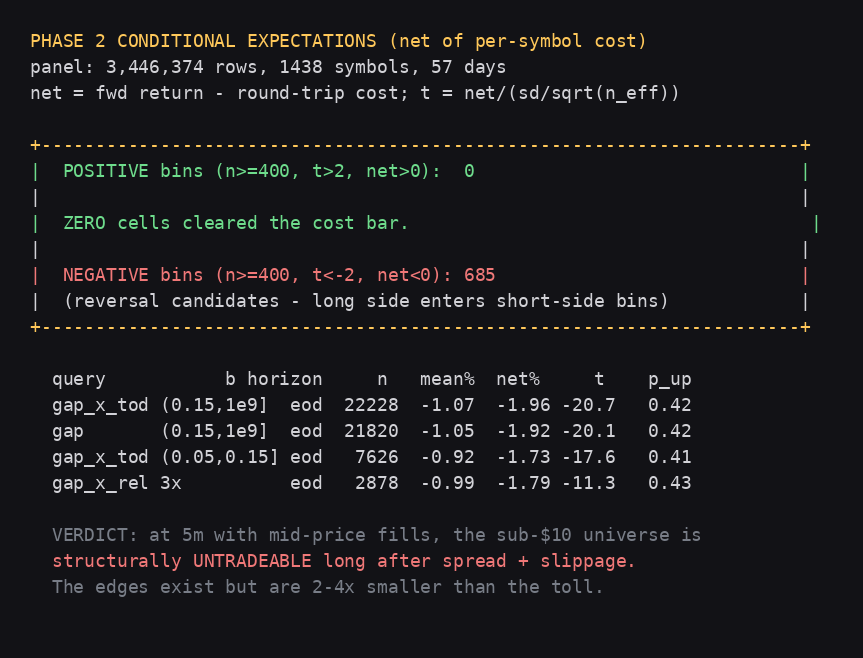
Stage one: the big grid. We built a conditional-expectation miner over a grid of generic conditions — returns, volume ratios, VWAP distance, opening-range position, prior-day state, time of day — and measured each cell's forward return against its cost. The result was blunt. Not a single cell out of thousands cleared the round-trip cost bar. Zero. For the sub-$10 momentum names we watch, the spread and slippage quietly ate every edge before we could act on it.
Stage two: walk-forward. Easily the most valuable test, because it caught us red-handed. One cell looked fantastic pooled together, but when we split the window, training the rule on June and July and testing it on August, the story collapsed: the rule lost money in its own training window. A rule tuned on everything would have gone live in June and bled through July. The pooled number was a mirage.
Stage three: two years, 105 blocks. The real gauntlet. We pushed the same family of conditions across two years, split into 105 thirteen-week blocks, requiring a survivor to be positive in 60% of them. Without a broad market condition attached, every single candidate died. The bounce we were chasing was panic-episodic: it shows up when markets panic and on no tidy schedule.
What survived: a small edge, measured plainly
One thing did survive, and it's worth being precise about what it is. We called it the panic-regression edge: on a day when the broad market is genuinely falling (SPY down more than 0.8% intraday), a liquid name that gapped down hard — somewhere in the 4% to 17% range — and is trading on three or more times its usual volume tends to bounce to the close. Not always. But measurably more often than base rate.
Across two years and 141 qualifying trades, it cleared costs with a 59% win rate and a median gain around half a percent per trade. Its real strength was in breadth: 67% of the 13-week blocks were positive, and an untouched 13-block window held 77% positive. It fired only about one or two times a month, a rare, specific setup rather than a daily machine.
And candour is the point, so here's the rest of it. The statistical significance was real but not overwhelming: p around 0.12 to 0.22 depending on how you cluster. It was concentrated in just a handful of names; drop the top five and the edge nearly vanished. And it has a nasty left tail: a few capitulation days where the whole thing lost real ground at once. We loosened it to fire more often and it went to zero; the edge only exists at the extremes. We tightened the stop to 3% and it destroyed the edge by exiting exactly when the bounce was about to happen. What survived is rare, fragile, and real, which is a very different thing from the perfect alert we went looking for.
The tool that taught us to slow down
The reports are dry little tables, and dry little tables are exactly the point. Here's one from the middle of the search, the screen that told us zero conditions cleared the cost bar:
What the search taught us
Sitting here now, the biggest lesson isn't any specific number. It's that the blunt answer was worth more than a flattering one would have been.
We are new to the stock market, still finding our niche. That's not an apology. It's why we did this the slow way instead of the exciting way. Had we tuned a rule on everything and shipped it, we'd have had a pretty backtest and a bleeding account. Instead the process refused to let us delude ourselves: the perfect alert doesn't exist, but the discipline of hunting for it, of measuring before believing, is the actual edge, and we get to keep that one forever.
Jimi still scans and ranks and watches. The panic-regression edge now lives in its own tab as a human-checked candidate list: the machine finds the setup, a person confirms the chart and the tape, and a hand on the keyboard decides. Small edges, carefully found, hand-executed.
That's a beginner's answer, and we're happy it's a modest one.
Disclaimer
Nothing in this article is financial advice. It is a technical account of how we built and tested our own trading tools, written for educational and informational purposes only. We are novice day traders, not financial advisors, and we have no track record. Trading involves substantial risk of loss, including the risk of losing your entire capital. Any strategy, edge, alert, or observation described here — including the panic-regression rule — is a research finding on historical data, not a prediction or an offer to trade. It may not work in the future, and it may already not be working. The data shown is from our own research pipeline and is unaudited; do not rely on it for any decision. Always do your own research, understand what you're buying, and consider consulting a qualified financial professional before making any investment. Past performance does not guarantee future results.
Revised 24 Oct 2026: a verbal tic, edited out.
Comments
No comments yet.
Please sign in to comment. Create an account if you don't have one.